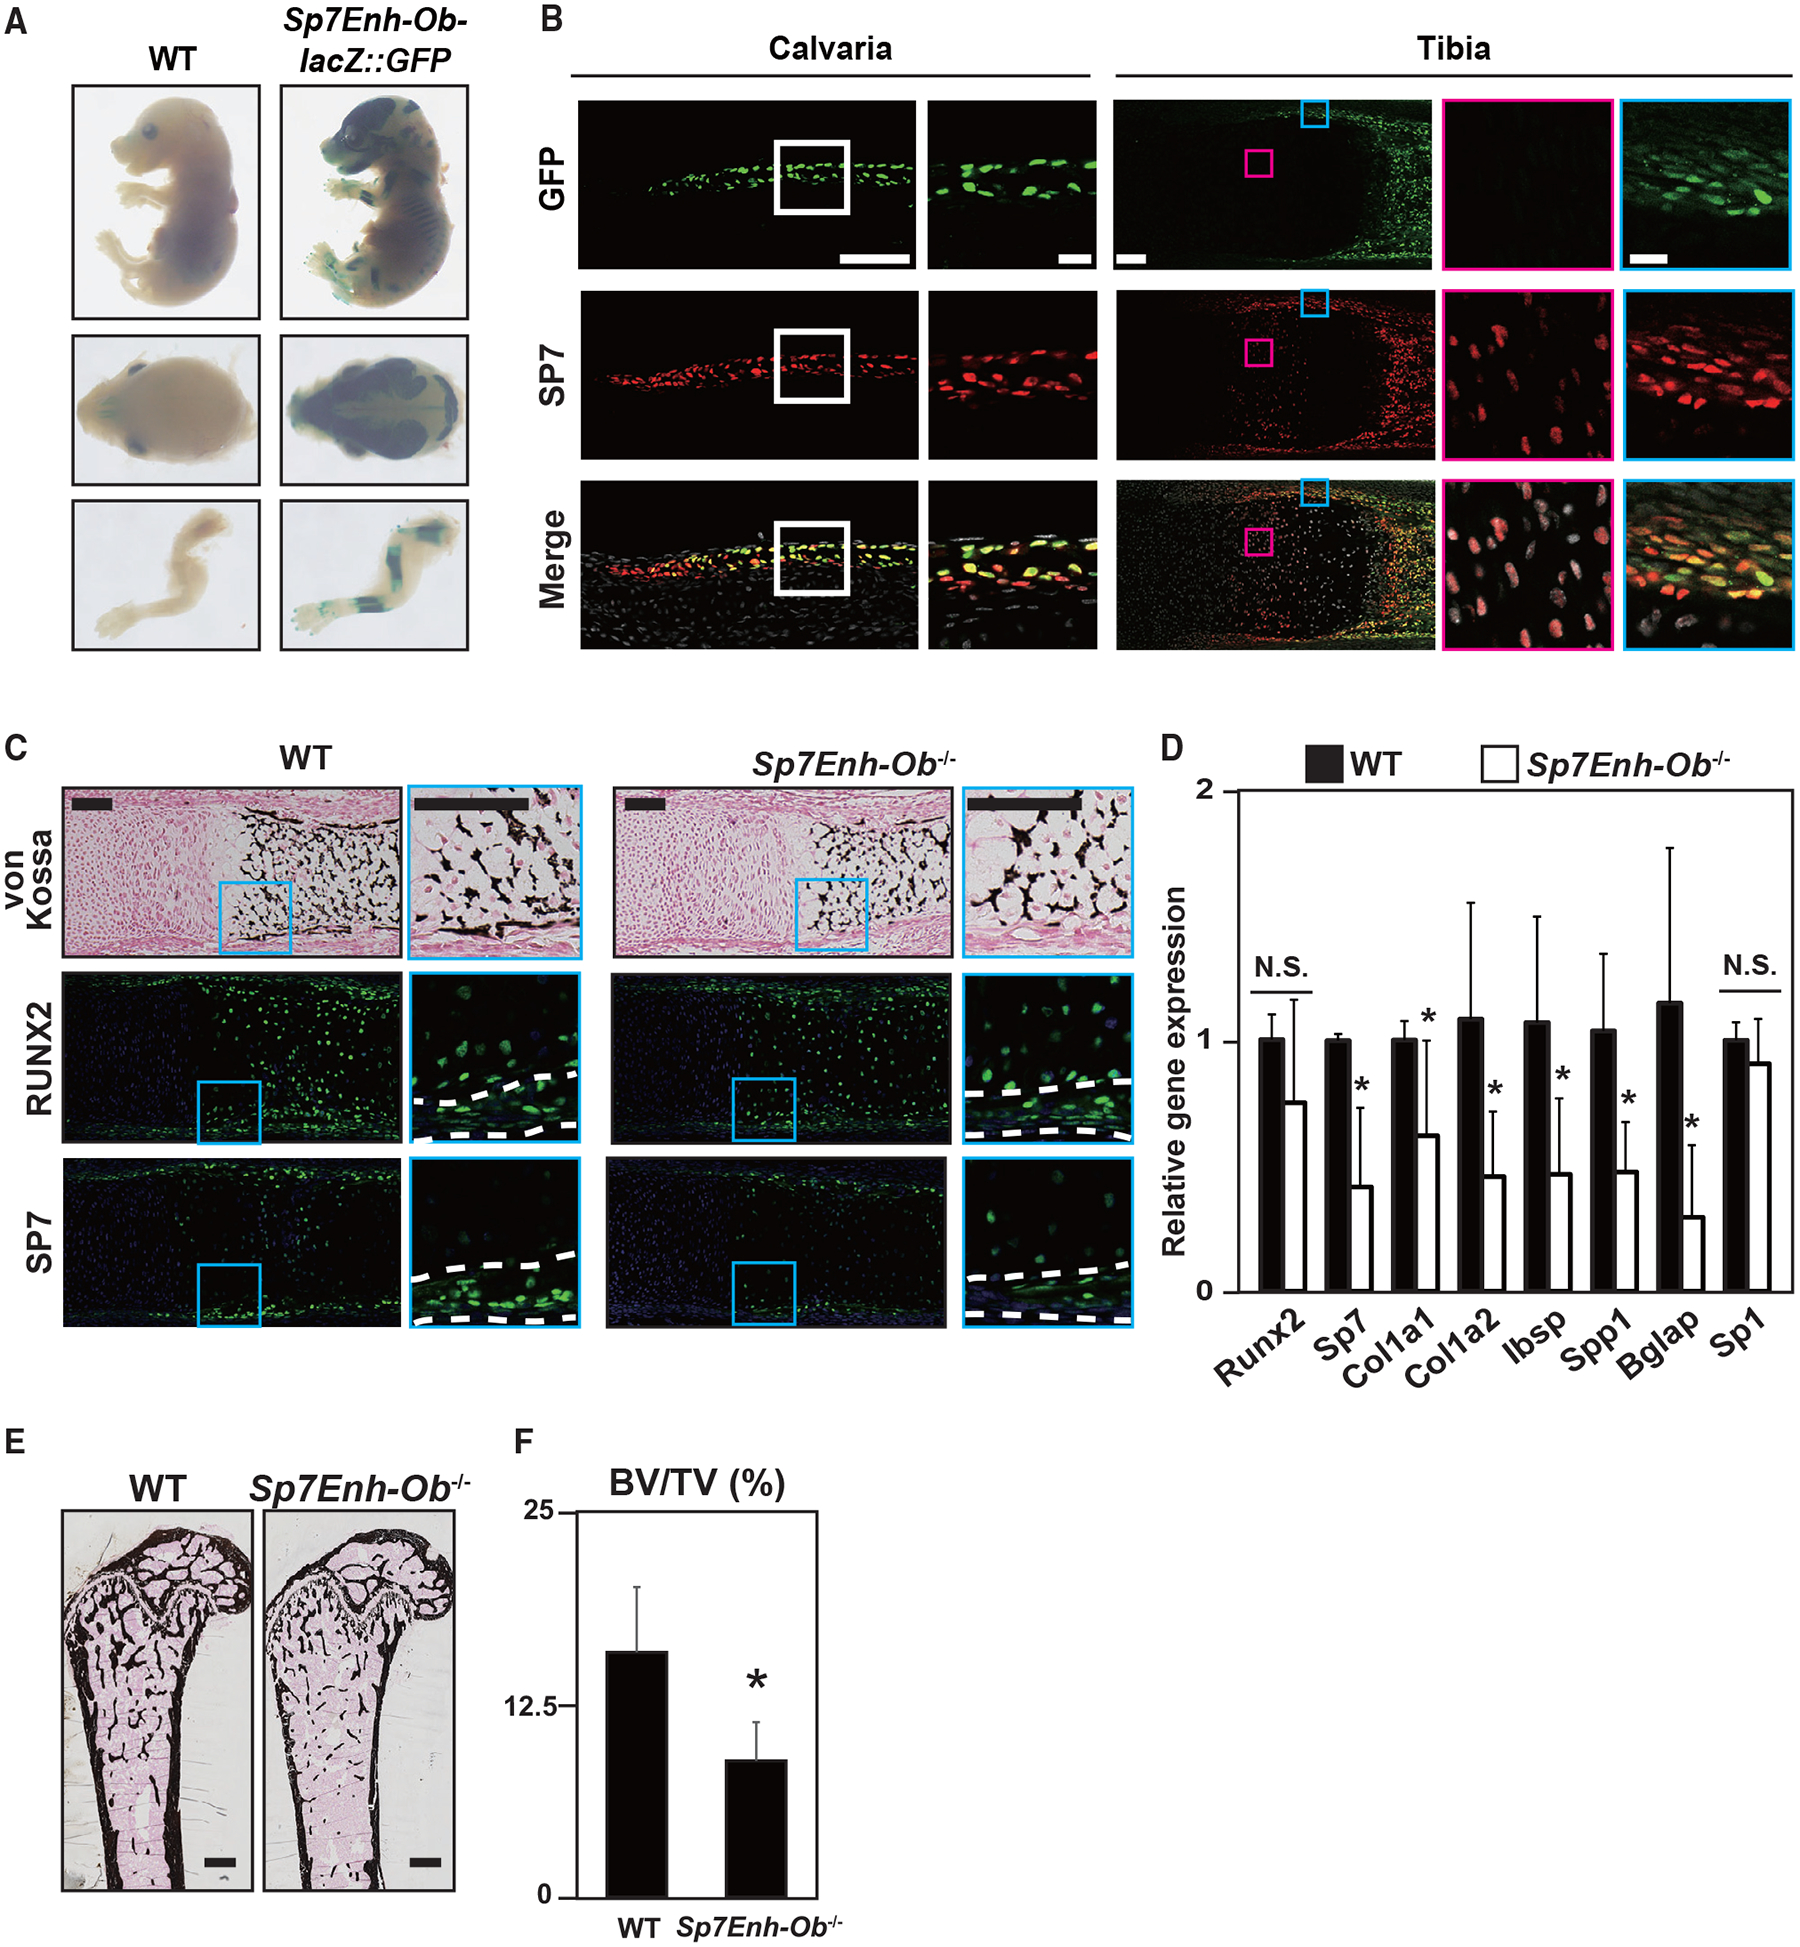
Figure 7. In vivo Sp7 enhancer activity and the contribution of the enhancer activity to skeletal development.

(A) β-Galactosidase staining to visualize Sp7Enh-Ob-driven lacZ:GFP reporter activity in E16.5 transgenic mice. Similar reporter activities were detected in 9 of 13 independent transgenic lines. Views of whole bodies, heads, and forelimbs are shown.
(B) Immunohistochemistry for SP7 and GFP signal of Sp7Enh-Ob-driven lacZ:GFP reporter activity in E17.5 calvariae and tibiae of transgenic reporter mice. Boxed regions are enlarged. Blue box, perichondrium containing Obs; pink box, prehypertrophic chondrocytes. Scale bars, 100 μm in the whole view and 20 μm in the enlarged view.
(C) von Kossa staining and immunohistochemistry for RUNX2 and SP7 in WT and Sp7Enh-Ob−/−metatarsals at E17.5. Regions between white broken lines indicate the perichondrium. Scale bar, 100 μm.
(D) qRT-PCR analysis of Sp1, Sp7, and osteogenic markers in primary Obs derived from the calvariae of WT and Sp7Enh-Ob−/−at E17.5. Cells were cultured with an osteogenic medium for 10 days. Data are presented as the mean ± SD of biological duplicate experiments with technical triplicates. *p < 0.05; N.S., not significant.
(E) von Kossa staining of 10-week-old femora in WT and Sp7Enh-Ob−/−. Scale bar, 500 μm.
(F) Microcomputed tomography (μCT) analysis for BV/TV (bone volume/tissue volume) in 10-week-old femora of Sp7Enh-Ob−/−male mice. Data are presented as the means ± SD. n = 6, *p < 0.05. Representative images obtained from at least biological duplicates are shown (B–D).
