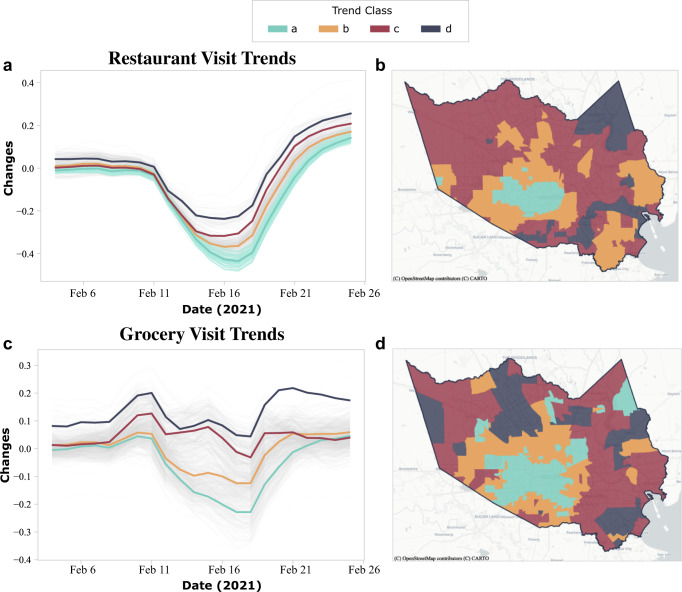
Fig. 9. Spatiotemporal distribution of the restaurant and grocery store visits in Harris County.
The results of the restaurant visits are shown in a and b, and the results of grocery store visits are shown in c and d. Four classes, from Class a through Class d, represent four patterns of visit trends from the most impacted class to the least impacted class, respectively. Trend line is the average of a group of census tracts having similar patterns and represents the visit fluctuations of these census tracts. The most impacted areas (Class a) of the restaurant and grocery store visits are close to Houston’s downtown areas.

