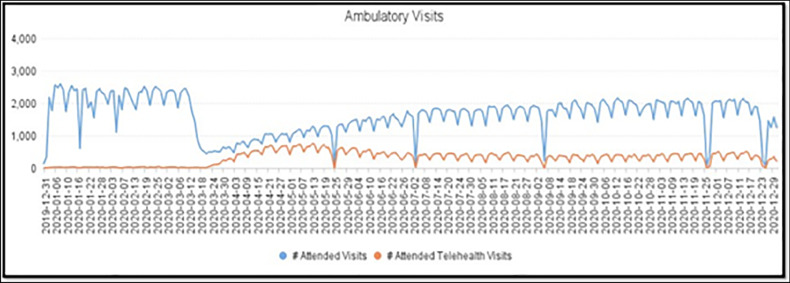
Fig. 1.
Number of ambulatory clinic visits at the Children’s Mercy Hospital in Kansas City, MO, vs weeks from December 31, 2019, to December 29, 2020. The blue line represents total visits, and the orange line represents the number of telehealth visits (mostly DTC). Note that the two lines are closest between mid-March 2020 to mid-May 2020 suggesting higher percentage of clinic visits (nearly 65%) being TH visits during that time. Image courtesy: Morgan Waller, Director of Telemedicine program at Children’s Mercy Hospital

