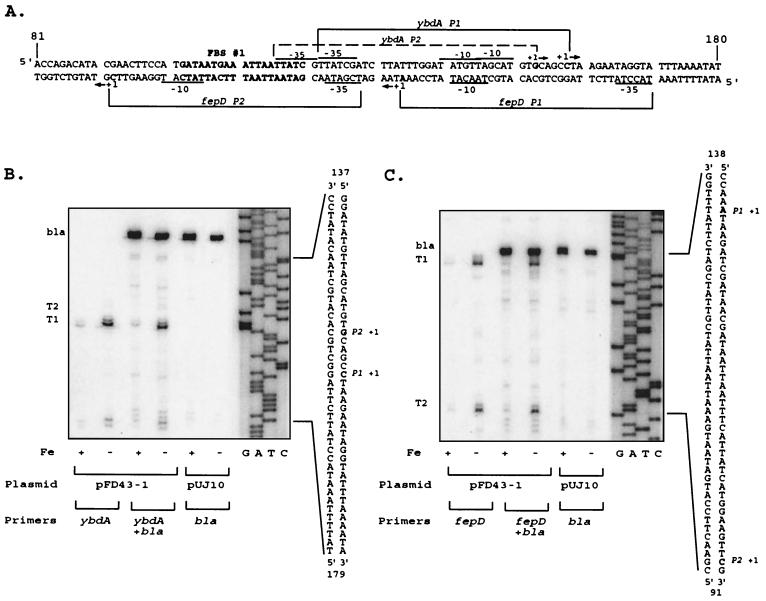
FIG. 2.
Transcripts originating from the fepD-ybdA bidirectional promoter region. (A) Sequence of the fepD-ybdA promoter region (extending from bp 81 to 180 shown in Fig. 1). The predicted “iron box” sequence (50) is boldfaced and designated as FBS #1. Brackets delineate the extent of the designated promoter regions, with corresponding −10 and −35 elements noted for each. The −10 TGn extensions for both P1 promoters are not designated. The dominant transcriptional start sites are shown in boldface and are denoted by +1, and the direction of transcription is indicated by the arrows alongside. (B) ybdA primer extension. Oligonucleotide pe4 (Table 1) was end labeled and used to map the ybdA transcription start sites as described in Materials and Methods. T1 and T2 represent the transcripts corresponding to the ybdA P1 and P2 promoters, respectively; bla represents the bla control transcript generated from the same RNA population with primer M8 (Table 1). The sequence ladder was generated with the pe4 primer on double-stranded pFD43-1 DNA template and was run alongside the extension reactions to identify the 5′ ends of the transcripts, which are noted on the corresponding sequence alongside. Conditions for cell growth prior to RNA isolation, the plasmid template for RNA expression, and primers used are given below the extension autoradiograms. Fe +, high iron; Fe −, low iron; pFD43-1, wild-type fepD-P43 promoter region; pUJ10, vector control. Primers (Table 1): ybdA, pe4 primer; ybdA + bla, pe4 and M8 primers; bla, M8 primer alone. (C) fepD primer extension. Oligonucleotide pe2 (Table 1) was used to map the fepD transcription start sites and generate the sequence markers. T1 and T2 represent the transcripts corresponding to the fepD P1 and P2 promoters, respectively, and bla represents the bla control transcript generated on the same RNA with primer M8 (Table 1). Conditions and designations are as described for the ybdA data in panel B.

