Figure 4.
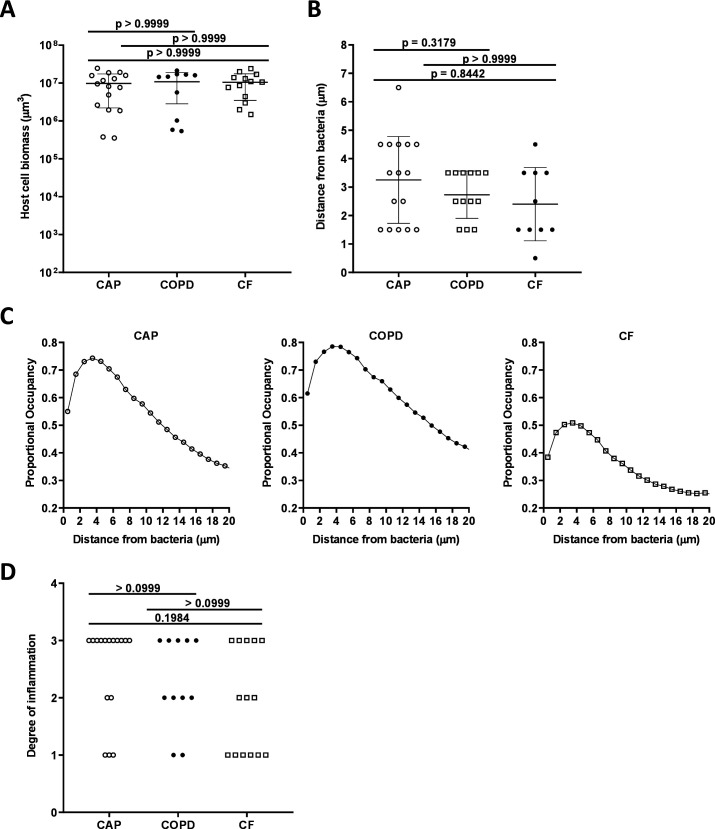
Host cell biomass in all infection types. (A) Mean total biomass of inflammatory cells by infection type. Confocal images of sectioned sputum were stained with DAPI and biomass calculated by the total number of and blue fluorescent voxels. (B) Distance from bacteria at which the proportional occupancy of inflammatory cells is highest for each sample type. (C) Proportional occupancy of inflammatory cells relative to bacteria. Representative samples of each type are shown: CAP (left), COPD (middle) and CF (right). Each point is the average value from 1000 random voxels in the image. (D) Blinded histopathological evaluation of sputum samples of degree of inflammation from sputum samples: from CAP (n=16), COPD (n=11) and CF (n=14). Degree of inflammation: 0: no inflammation, 1: mild inflammation, 2: moderate inflammation and 3: severe inflammation. Statistical significance was determined using (A) and (B) ordinary one-way ANOVA followed by Bonferroni multiple comparison test and (D) Kruskal-Wallis test (p≤0.05). ANOVA, analysis of variance; CAP, community-acquired pneumonia; CF, cystic fibrosis; COPD, chronic obstructive pulmonary disease; DAPI, 4’,6-diamidino-2-phenylindole

