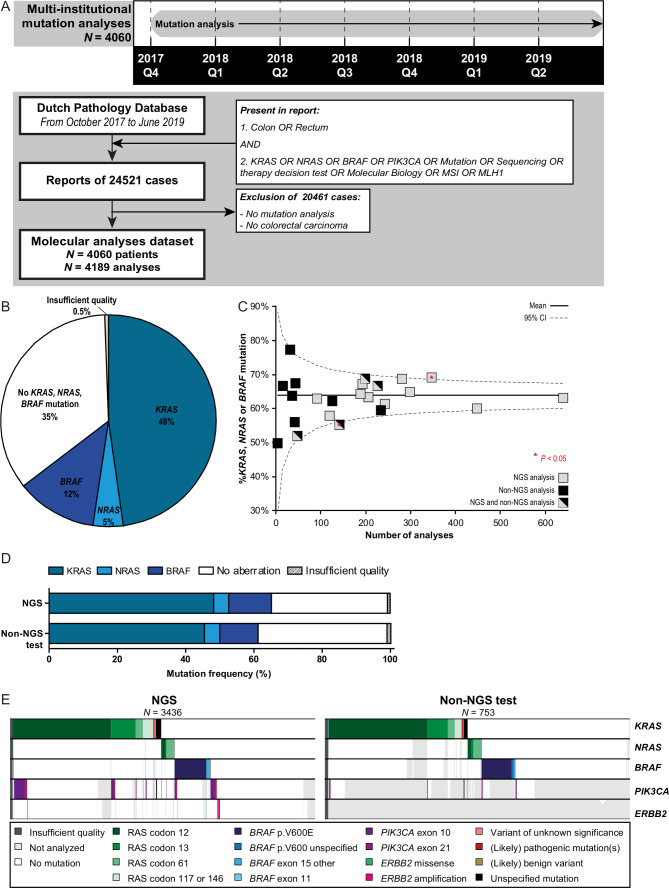
Figure 1.
Molecular characterisation of patients with colorectal cancer (CRC). (A) Timeline and flow chart showing the search strategy to obtain all nationwide pathology reports of mutation analysis of patients with CRC performed between 1 October 2017 until 30 June 2019. A large proportion of reports was excluded as no mutation analyses were present (ie, the queries ‘molecular biology’, ‘MSI’ (microsatellite instability) and ‘MLH1’ obtained high amount of reports with immunohistochemistry of mismatch repair proteins). Manual curation of obtained pathology reports showed 4060 patients with CRC undergoing predictive mutation analyses in this 21-month study period. (B) Frequency of reported KRAS, NRAS and BRAF mutations obtained from the pathology reports depicted in panel A. (C) Funnel plot showing the reported diagnostic yield (ie, percentage of KRAS, NRAS and BRAF mutations) per pathology department. Nationwide percentage and 95% CI are shown. (D) Frequency of reported KRAS, NRAS and BRAF mutations by multigene panel next-generation sequencing (NGS) and non-NGS analysis. (E)Mutational landscapes of CRC cases concerning KRAS, NRAS, BRAF, PIK3CA and ERBB2 alterations. Results of multigene panel NGS approaches are shown left and non-NGS approaches right. Each column represents a tumour sample. Each row represents a gene. A coloured bar represents a variant (see legend), a white bar represents no alteration and a grey bar represents not analysed (ie, not present in NGS panel or single gene analysis).

