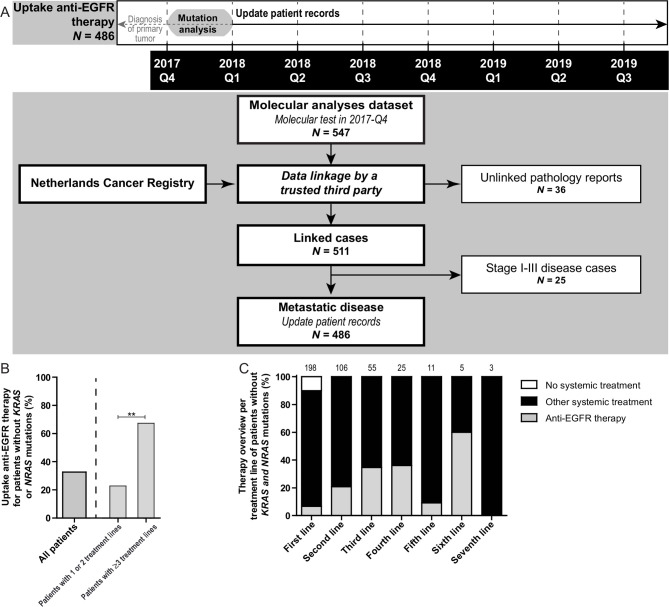
Figure 3.
Uptake of anti-epidermal growth factor receptor (EGFR) therapy in patients with metastatic colorectal cancer (mCRC). (A) Time line and flow chart showing the data collection of both synchronous and metachronous mCRC that underwent mutation analysis between October and December 2017. These patients were linked to the Netherlands Cancer Registry by a trusted third party, enabling therapy registration of these patients. Twenty-five of the patients were excluded for further analysis, as they were diagnosed with stage I–III CRC in 2017 and hence were no candidates for anti-EGFR therapy. Patient records were fully updated including specification of all treatment lines for patients with diagnosis of the primary tumour from 2015 onwards (N=402). For patients with a primary tumour before 2015 (N=84), registration was limited to whether anti-EGFR therapy was applied or not. Unlinked cases were caused by limitations in the linkage procedures. (B) Uptake of anti-EGFR therapy in patients without a KRAS or NRAS mutation merged over all treatment lines (left). In the right panel of the graph uptake for patients that received one or two treatment lines is compared with patients receiving three or more treatment lines. NB: for 35 patients without a KRAS or NRAS mutation it was only registered whether anti-EGFR therapy was applied or not. The Fisher’s exact test was applied to study differences in molecular testing rates. **P<0.001. (C) Overview of the proportions of patients that were treated with anti-EGFR therapy per treatment line. The number of patients present in each line is depicted on top of each bar.

