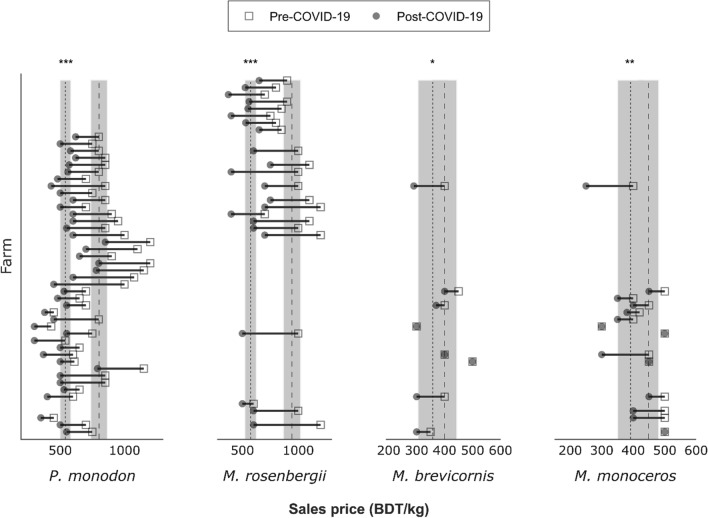
Fig. 3.
Effect of COVID-19 on the farm gate prices of shrimp and prawn produce. Horizonal lines indicate the difference, the dashed vertical lines are the mean farm gate price pre-COVID-19 (dotted) and post-COVID-19 mean farm gate price (dashed); and the shaded areas are the 95% confidence levels. Significance of differences in farm gate prices (pre-COVID-19 versus post-COVID-19) using paired Student’s t test are shown (***p < 0.001; **p < 0.01; *p < 0.05)

