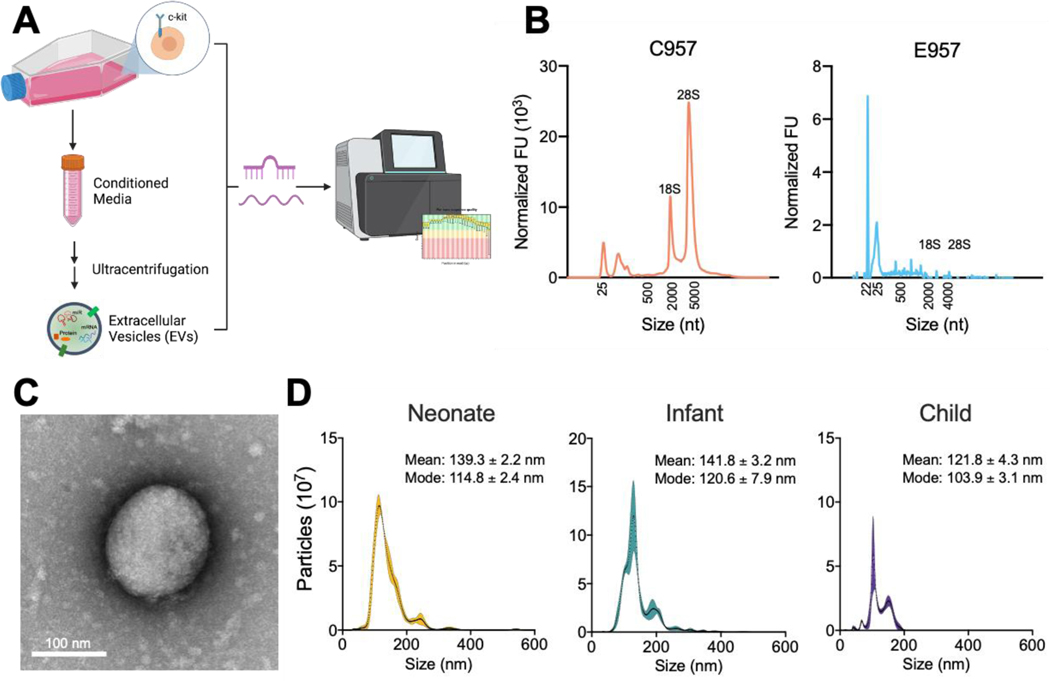
Figure 1. CPC-EV isolation and characterization.
a Schematic of study: CPCs and CPC EV miRNA and total RNA are sequenced and analyzed (created from Biorender.com).
b Bioanalyzer profile for patient matched CPC and CPC-EV RNA content.
c Transmission electron microscopy image of CPC EV. Scale bar, 100 nm.
d Vesicle size distribution histogram by nanoparticle tracking analysis in neonate, infant, and child CPC-derived EVs. Shaded region indicates standard error.

