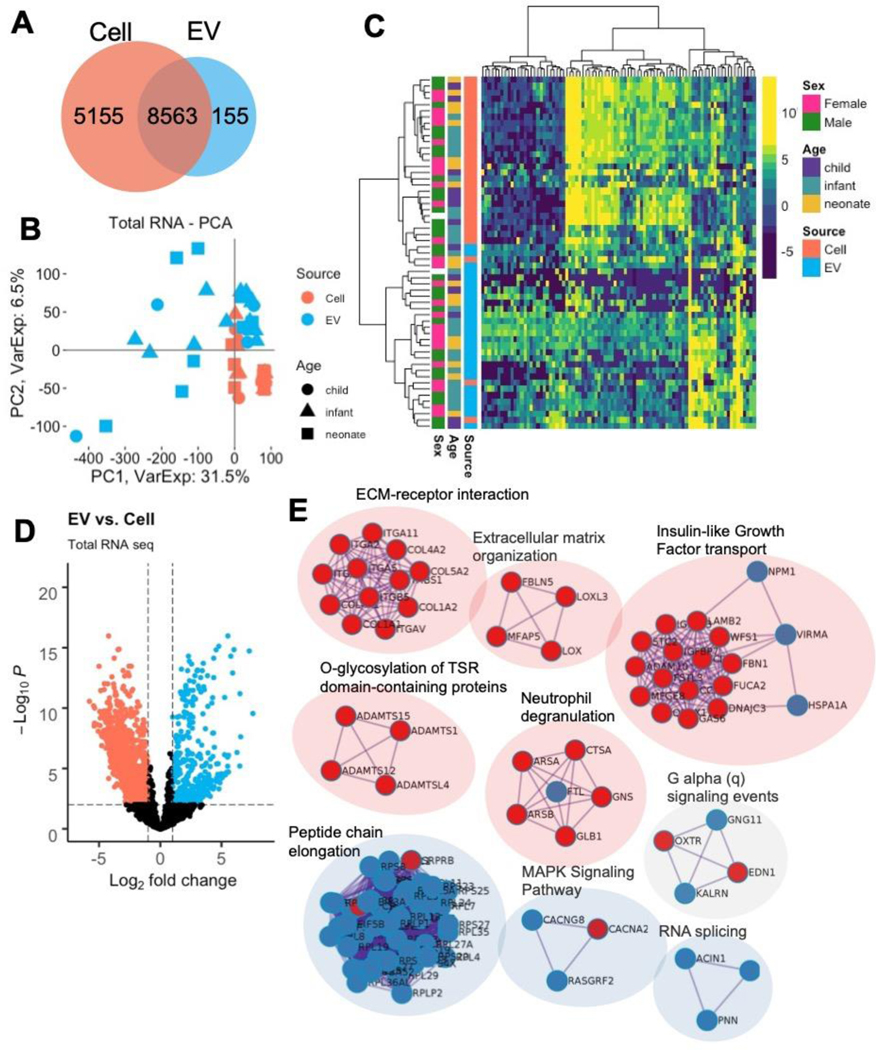
Figure 2. Differential expression of CPC and CPC-EV total RNAseq.
a RNAs expressed in CPCs and CPC EVs.
b PCA plot of CPC and CPC EVs show clustering by RNA source across PC1.
c Heatmap of top 1% variable RNAs show clustering of samples by source: cell and EV.
d Volcano plot of differentially expressed RNAs in CPCs and CPC EVs.
e Network of top enriched terms from differentially expressed RNAs upregulated in CPCs (red) vs. EVs (blue) using the Metascape tool.

