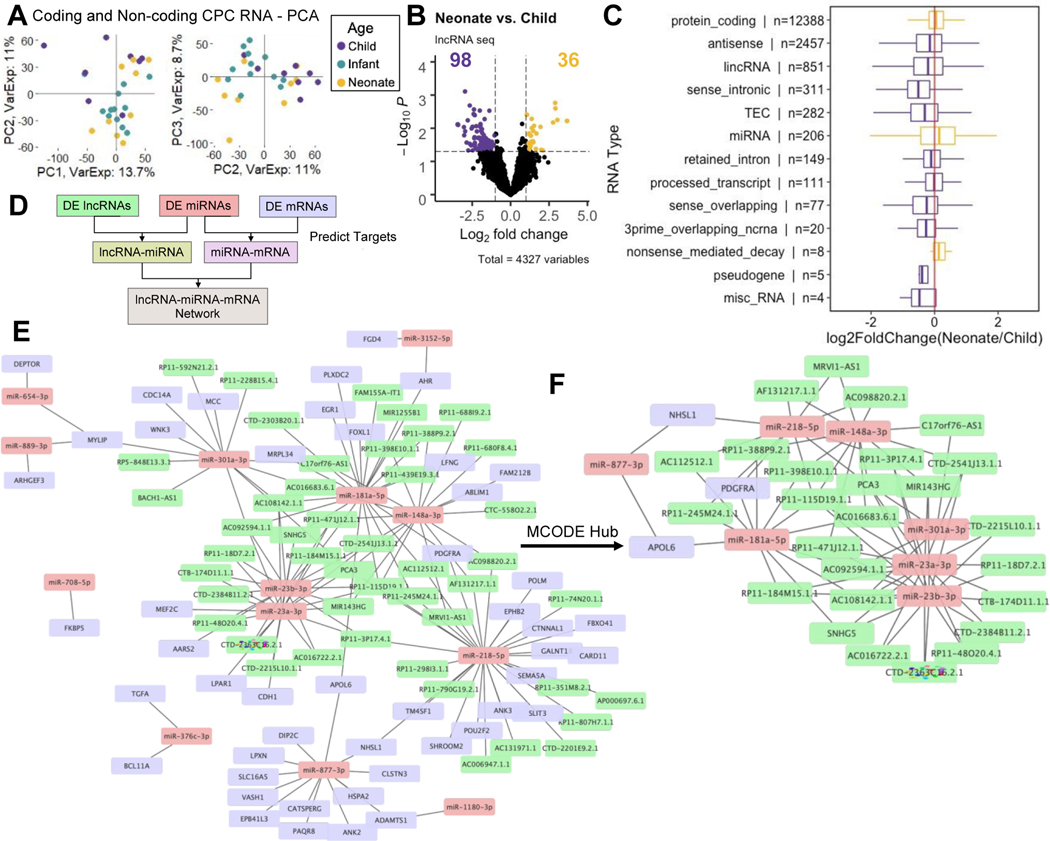
Figure 5. ceRNA network of neonate and child CPCs.
a PCA plot of CPC coding and non-coding CPC RNAs (PC1, PC2, PC3) show clustering by patient age group.
b Volcano plot of differentially expressed non-coding RNAs between neonate and child CPCs. Thirty-six and 98 RNAs are upregulated in neonate and child cells, respectively.
c Fold-change values for each RNA in various categories. RNAs upregulated in child CPCs (purple), compared to neonate CPCs (yellow). N represents number of measured RNAs in each category.
d Schematic for ceRNA network construction: differentially expressed RNAs between neonate and child CPCs were matched in miRcode and miRTarBase by putative target sites.
e Full ceRNA network of differentially expressed RNAs (neonate vs. child CPCs) with 107 nodes and 144 edges.
f Reduced MCODE network of the most highly connected RNA nodes.

