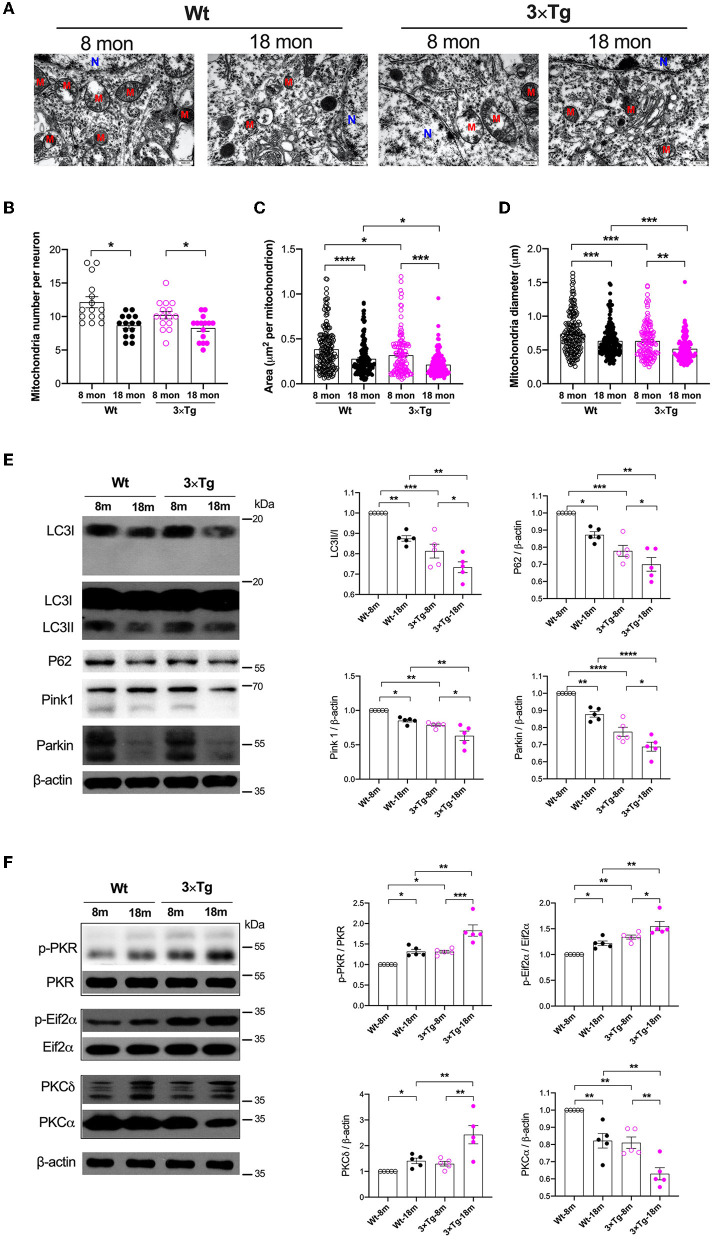
Figure 1.
Variations of mitochondria and autophagy during aging in the wild-type and 3×Tg AD mice. (A) Representative electron microscopy photographs of mitochondria in the hippocampal neurons in different ages of wild-type and transgenic AD mice (N, nucleus; M, mitochondria; scale bar = 500 nm). (B–D) Quantification of mitochondrial number, area, and diameter in the hippocampal tissues from two strains of mice by electron microscopy, n = 182, 160, 138, 121 mitochondria from 15 neurons in five mice per group. (B): F(3, 56) = 8.787, P < 0.0001, n = 15; (C): F(3, 597) = 18.49, P < 0.0001, n = 121–182; (D): F(3, 597) = 20.05, P < 0.0001, n = 121–182. (E) In wild-type and 3×Tg AD mice, the relative expressions of autophagy-related proteins in the hippocampi were quantified by Western blotting analysis. LC3: F(3, 16) = 24.74, P < 0.0001; P62: F(3, 16) = 22.62, P < 0.0001; Pink1: F(3, 16) = 17.26, P < 0.0001; Parkin: F(3, 16) = 43.14, P < 0.0001. (F) Quantitative analysis of the relative expression of PKR, Eif2α, PKCδ, and PKCα in the hippocampal tissues in two strains of mice at different ages. p-PKR/PKR: F(3, 16) = 20.58, P < 0.0001; p-Eif2α/Eif2α: F(3, 16) = 18.22, P < 0.0001; PKCδ: F(3, 16) = 10.51, P = 0.0005; PKCα: F(3, 16) = 21.72, P < 0.0001. Wt, wild-type mice; 3×Tg, triple transgenic mice. Data are presented as mean ± SEM and were analyzed using one-way ANOVA using Tukey's post hoc test, n = 5, *P < 0.05, **P < 0.01, ***P < 0.001, ****P < 0.0001.

