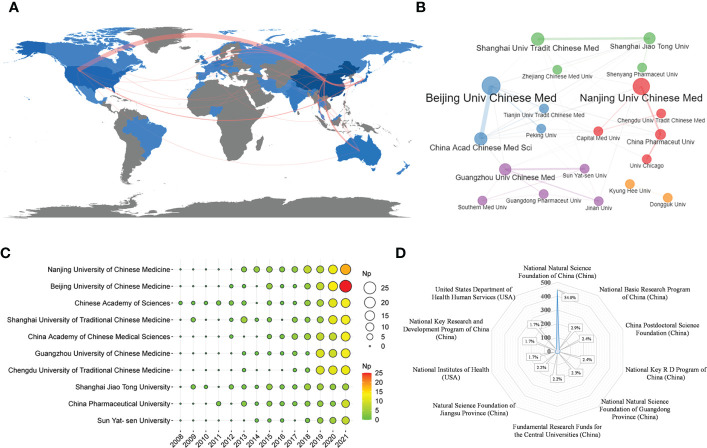
Figure 3.
(A) Country scientific production and international collaboration network in TCM/GM (the red line represents the collaboration network between countries, the thickness of the line represents the strength of collaboration). (B) Collaboration network of the top 20 corresponding institutions in TCM/GM. (C) Annual scientific production of the top 10 most productive institutions over time in TCM/CM based on WoS (the size of the circle represents the number of publications, and the larger the circle, the more the number of publications). (D) The top 10 funding agencies in the support of TCM/GM research.

