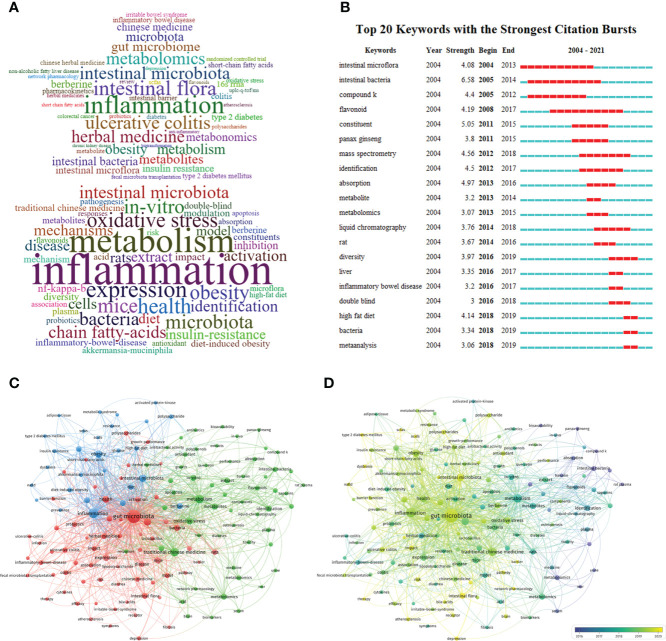
Figure 7.
(A) Distribution of top 50 keywords in TCM/GM (exclude main search terms, the upper part is the author keywords, and the lower part is the keywords plus). (B) The top 20 keywords with the most bursts base on CiteSpace (The year between ‘start’ and ‘end’ represents the period in which keywords are more influential. The year with light green indicates that the keywords have not yet appeared, the year with dark green indicates that the keywords have less influence, and the year with red indicates that the keywords have more influence). (C) Cluster analysis of high-frequency keywords (frequency ≥ 10) in TCM/GM (different colors represent different clusters, the size of the circle represents the frequency the keywords appear, and the thickness of the line represents the total link strength between keywords). (D) Trends in keywords (frequency ≥ 10) over time base on VOSviewer (the blue dots represent the earliest keywords and the yellow dots represent the latest keywords).

