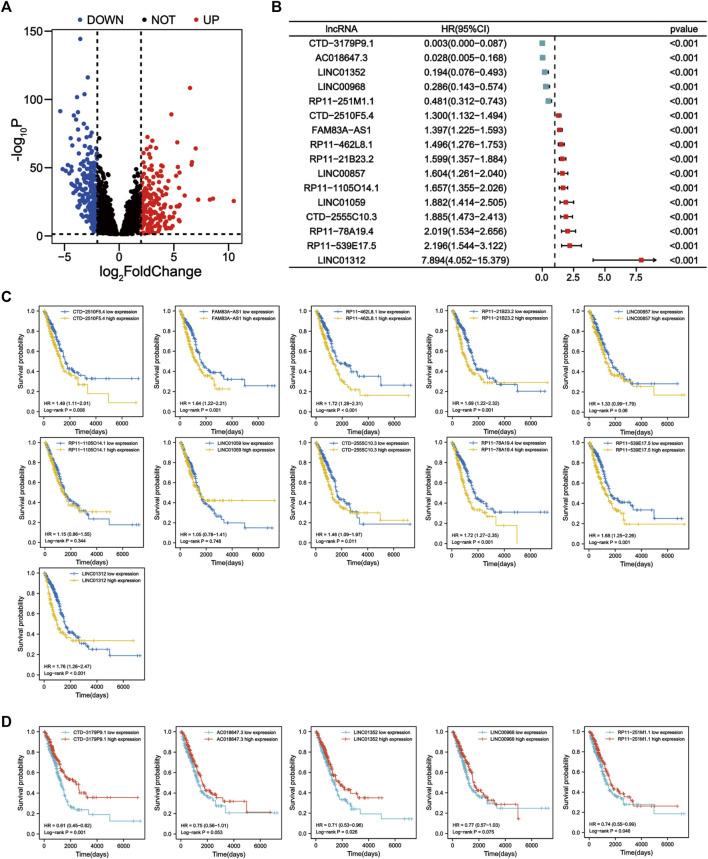
FIGURE 2.
Identification of prognostic apoptosis-related lncRNAs in LUAD patients. (A) The differentially expressed apoptosis-related lncRNAs were shown in the volcano plot. (B) Forest plot showing the HR (95% CI) and p values of lncRNAs screened by univariate Cox regression analysis (all p < 0.001). (C) Kaplan–Meier survival curves for eleven unfavorable prognostic apoptosis-related lncRNAs. (D) Kaplan-Meier survival curves for five apoptosis-related lncRNAs with a good prognosis.

