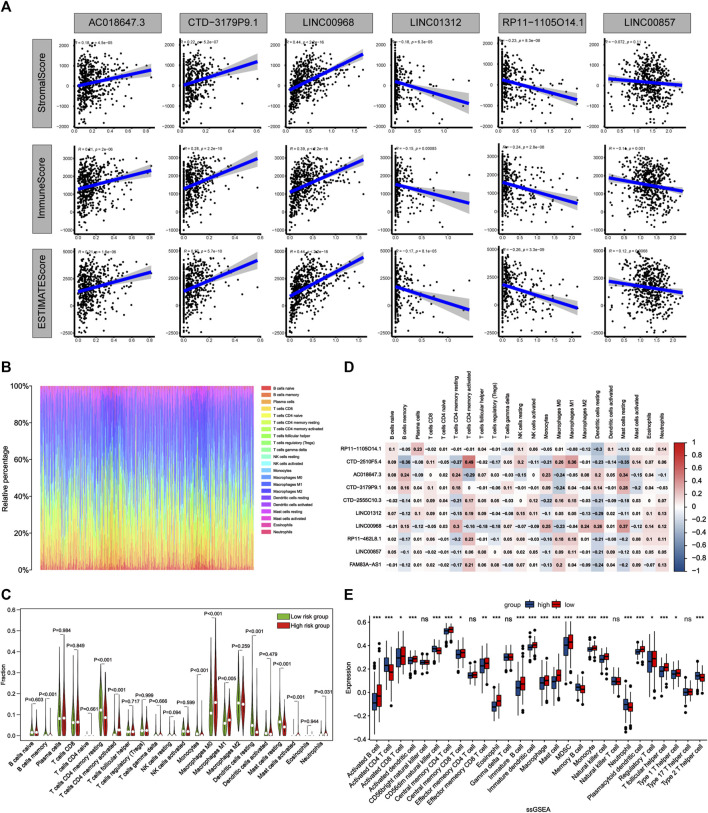
FIGURE 9.
Comparison of the immune microenvironment of LUAD patients between the high- and low-risk groups. (A) Correlation matrices between six lncRNAs expression and stromal score, immune score, and estimate score. (B) Barplot shows the proportion of 22 types of TICs in LUAD samples. The column names of the plot were sample ID. (C) Violin plot showed the ratio of 22 immune cell types between the low-risk and high-risk groups, and Wilcoxon signed-rank test was used for significance test. Red indicates the high-risk group and green indicates the low-risk group. (D) Heatmap showing the correlation between 22 TICs and 10 lncRNAs. (E) The single sample gene set enrichment analysis (ssGSEA) algorithm compares the expression of 28 immune cells between patients in high and low risk groups. *p < 0.05; **p < 0.01; ***p < 0.001.

