FIGURE 3.
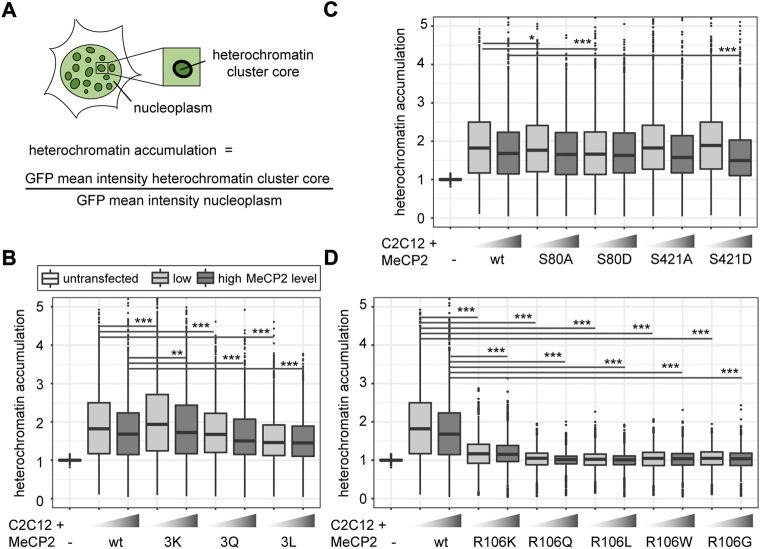
Comparative analysis of heterochromatin accumulation of MeCP2 mutant constructs transfected in C2C12 mouse myoblast cells. (A) Heterochromatin accumulation was calculated as the ratio of GFP mean intensity at heterochromatin versus nucleoplasm. The boxplots depict the heterochromatin accumulation of mutant MeCP2 including R91, R162, and R167 (B), S80 and S421 (C), and R106 (D) constructs for low and high MeCP2 levels in the cells. Three biological replicates, statistical significance calculated using Wilcoxon-Rank test. *p < 0.05, **p < 0.005, ***p < 0.001. p-values and n-values are summarized in Supplementary Table S6.

