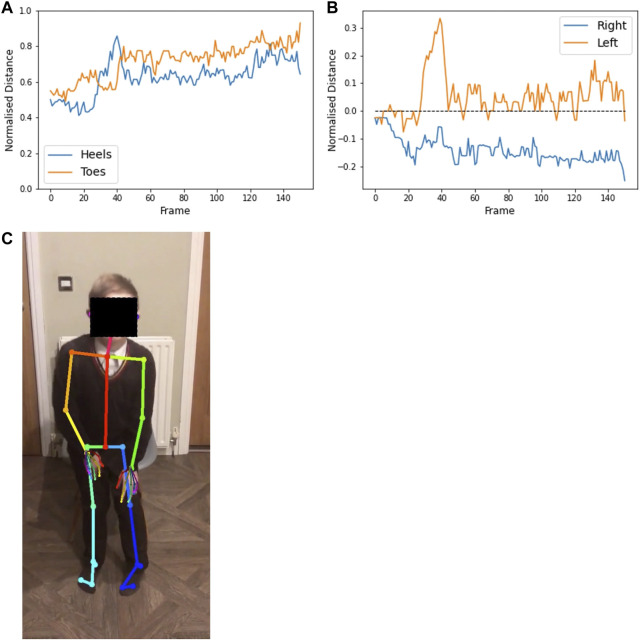
FIGURE 10.
Plot (A) shows the normalised distance between the heels (blue) and big toes (orange) throughout a video from participant 2 (age 13) completing the sit-to-stand test. Plot (B) shows the horizontal distance between the heel and toe of each foot (values are positive when the heels are pointing outward relative to the toes), with the right foot (blue) remaining toes turned out (below the dashed line) and the left foot (orange) tending to have toes turned in. The feet remain relatively close together, but the left heel slides outwards [as seen in the annotated image of frame 38 (C)] when the participant stands up. Distances are normalised by the lower leg length.

