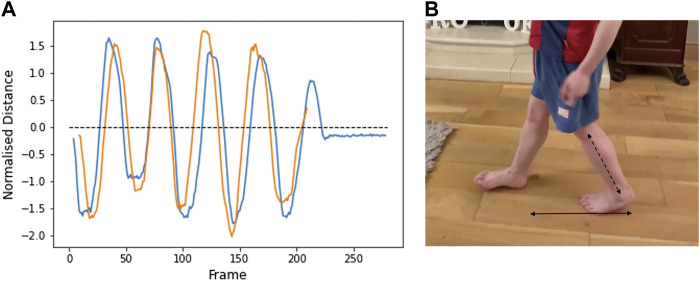
FIGURE 2.
(A) Horizontal heel-to-heel distance over the duration of two separate videos from Participant 1 (age 7). Positive values: right heel is in front of left heel. Negative values: Right heel is behind left heel. Peaks represent the extent of each step. (B) Bottom arrow shows the plotted heel-to-heel horizontal distance. Distances are normalised to lower leg length (diagonal arrow).

