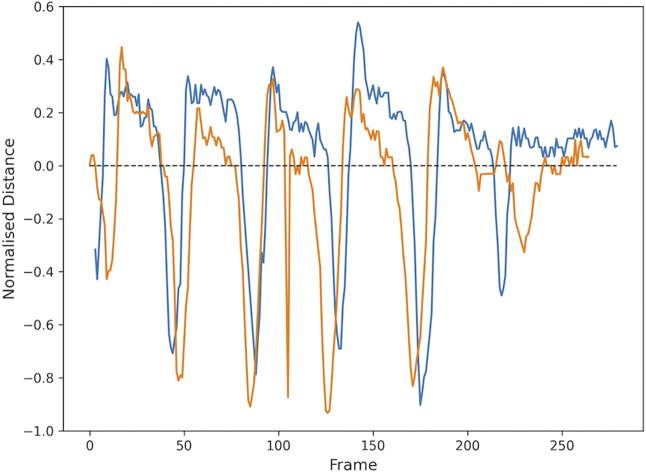
FIGURE 3.
Vertical distance between left heel and toe over the duration of two separate videos from participant 1 (age 7). Oscillation peaks represent the alternate rising of the heel (below the dashed line) and toe (above the line). Distance decreases to zero as the foot becomes flat. Distance is normalised to the foot length.

