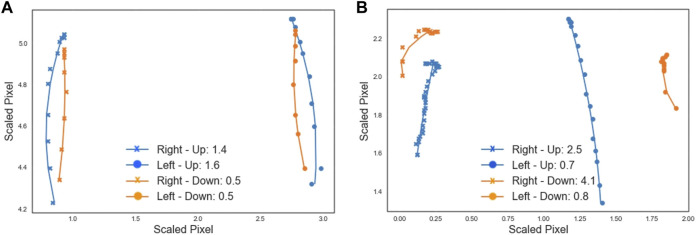
FIGURE 7.
Each data point shows the scaled location of the left (circle) or right (cross) elbow in a frame of the video showing the lift (blue) or lower (orange) motion. A curve is fit to follow the trajectory and the plot legend shows the RMSE goodness of fit value associated with each curve, providing a measure of smoothness. (A) The video from participant 1 (age 7) shows reasonably smooth movement, with smoother movement on lowering than lifting. (B) The movement in the video from participant 10 (age 15) is relatively less smooth, particularly movement of the right arm. Pixel locations are scaled to allow for comparison across different videos.

