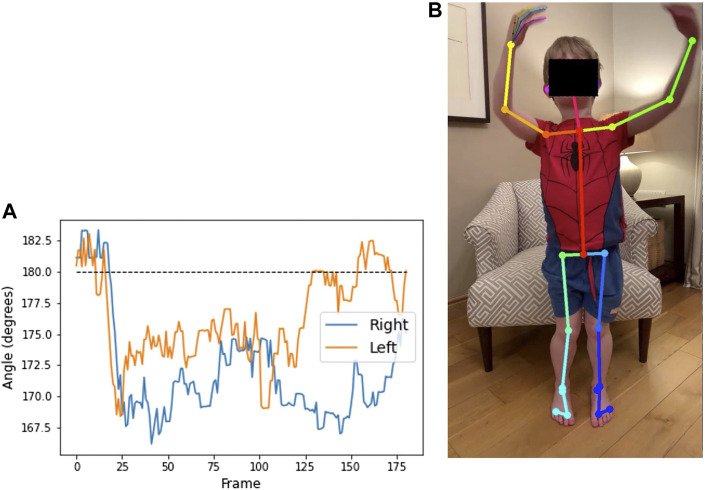
FIGURE 9.
Plot (A) shows the angle at the outer knee over the duration of a video from participant 1 (age 7) completing the sit-to-stand test. Angle of the legs relative to the camera makes the value at the start and end of the video, while seated, difficult to interpret. The region from frame 30 to frame 120 shows the duration of the standing phase. The dashed line illustrates that the legs are straight. Below the dashed line implies that the knees are Q20 pointed inwards, as seen in the annotated image of frame 44 (B).

