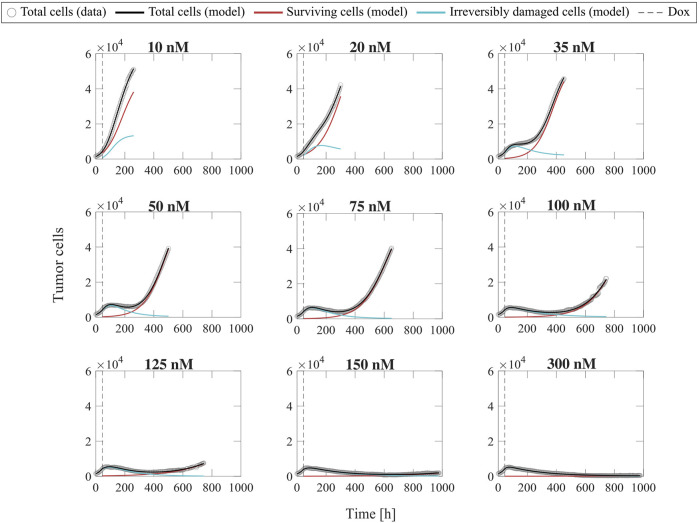
FIGURE 2.
Representative fits of the single-dose model for varying concentrations of doxorubicin. Data and model fittings are shown for a representative replicate treated with 10–300 nM doxorubicin concentrations (Experiment 1, Table 1). Experimental data are shown in gray circles. The number of total cells, surviving cells, and irreversibly damaged cells obtained with the fitted single-dose model are shown in black, red, and blue solid lines, respectively. The time of doxorubicin delivery (Dox) is represented with a vertical grey dashed line. As doxorubicin concentration is increased, we observe a decrease in the growth rate of surviving cell subpopulation and a faster transition from growth to treatment-induced death in irreversibly damaged cell subpopulation. These drug-induced effects ultimately translate into a longer delay (or even suppression) of total tumor cell population growth post-treatment and lower total tumor cell count for higher doxorubicin concentrations, indicating superior tumor control overall. The median and range of the quality of fit metrics across all replicates in Experiment 1 (n = 60, Table 1) are NRMSE: 3.33 [0.80, 12.20], : >0.99 [0.96, >0.99], PCC: >0.99 [0.98, >0.99], and CCC: 0.99 [0.97, >0.99].

