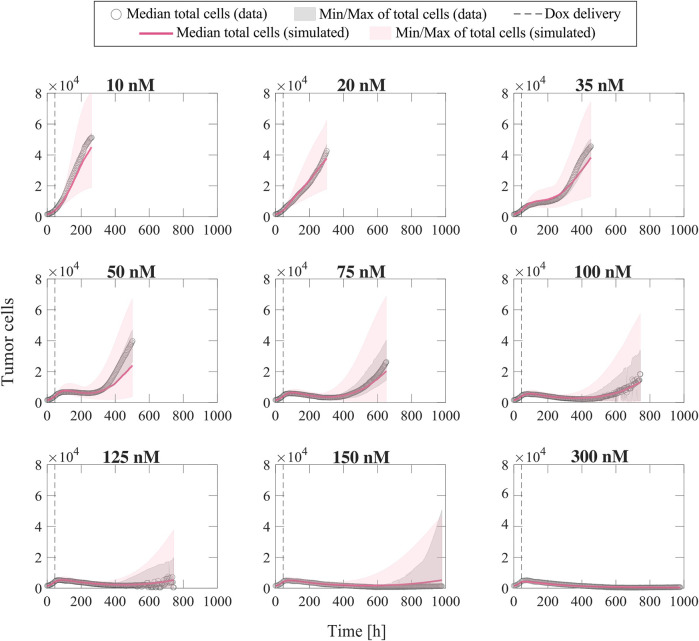
FIGURE 4.
Comparison of simulated tumor cell population growth based on empirical parameter formulas with respect to experimental data for varying doxorubicin concentrations. We sampled the 95% confidence intervals for the fitted empirical parameter formulas in Figure 3 using Latin hypercube sampling to obtain 200 parameter combinations for each doxorubicin concentration, with which we carried out corresponding simulations with the single-dose model. The median and range of the model simulations are plotted with the median and range of the experimental data from Experiment 1 (Table 1) at each time point for comparison. The median of the experimental data is shown with gray circles, and the range of the experimental data is represented with gray shaded regions. The median of the model simulations is plotted as a pink solid line, and the range of the simulations is shown as pink shaded regions. The time of doxorubicin delivery is represented with a vertical grey dashed line. We observe that our fitted parameter formulas from Figure 3 can reproduce a wide range of tumor cell population dynamics, including those observed in the varying concentration datasets (Experiment 1, Table 1).

