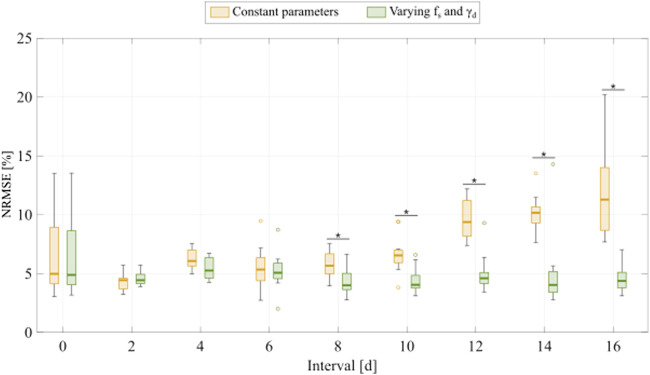
FIGURE 5.
Comparison of fitting the experimental data for varying inter-treatment intervals with the multiple-dose model with constant versus varying parameters. For each inter-treatment interval tested in Experiment 2 (Table 1), we compared the normalized root mean squared error (NRMSE) calculated from the fittings using the multiple-dose model with constant parameters (yellow boxplots) with the NRMSE calculated from the fittings using the multiple-dose model with varying and (green boxplots). Outliers are represented with circles. At inter-treatment intervals of 8, 10, 12, 14, and 16 days, there is a significantly lower NRMSE when the model with varying and is used ( : 0.0061, 0.0017, 1.56 , 5.92 , 3.66 , respectively). An asterisk (*) indicates 0.05 (two-sided Wilcoxon rank sum test).

