FIGURE 9.
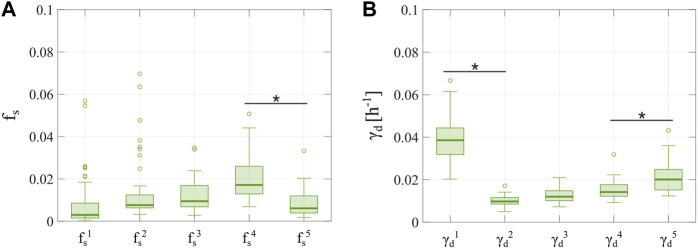
Distributions of and obtained from fitting the multiple-dose model to the experimental data for a varying number of doses with a 2-week inter-treatment interval. The parameter distributions are represented as boxplots and were obtained from fitting the multiple-dose model to the 2-week inter-treatment interval datasets from Experiment 3 (Table 1), in which the model with varying and was used. Outliers are represented as circles. Panel (A) shows the distributions of the fraction of surviving cells, such that a new value for is defined for each drug dose ( ). We observe an increasing trend in the first four parameters, which suggests an increasing chemoresistance with each dose. However, takes on significantly lower values than ( ), which suggests that adding more doses may limit the trend towards chemoresistance. Panel (B) shows the distributions of the doxorubicin-induced death delay rate of irreversibly damaged cells, such that a new value of is defined for each drug dose ( , ,…, ). The values for are significantly lower than those of ( ). Hence, the second irreversibly damaged subpopulation shows a slower transition to treatment-induced death. However, the subsequent doxorubicin doses induce irreversibly damaged subpopulations exhibiting an increasing , with being significantly larger than This observation further suggests that past a certain number of doses, initial chemoresistance appears to be reverted. An asterisk (*) indicates 0.05 (two-sided Wilcoxon rank sum test).

