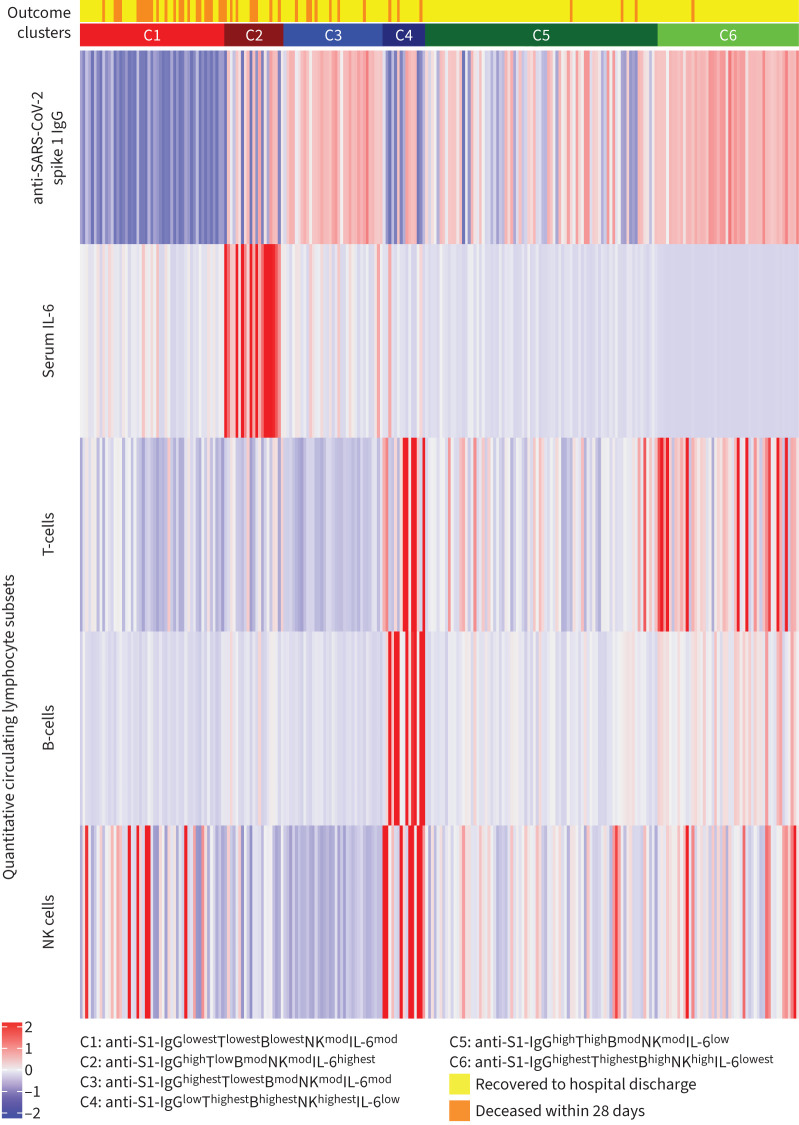
FIGURE 3.
Immune responses of 254 hospitalised COVID-19 patients across the six clusters (C1–6). The normalised values of parameters are shown. Heatmap: red indicates the individual response is greater than the population mean, and blue indicates that the individual response is less than the population mean. SARS-CoV-2 anti-S1 IgG antibodies were measured a median of 4 days after admission to the hospital. Decreases in circulating lymphocyte subsets were defined as the lowest T-cell, B-cell and natural killer (NK) cell absolute counts recorded after admission. Interleukin-6 (IL-6) increase was defined as the maximal serum level recorded after admission.

