
FIGURE 2.
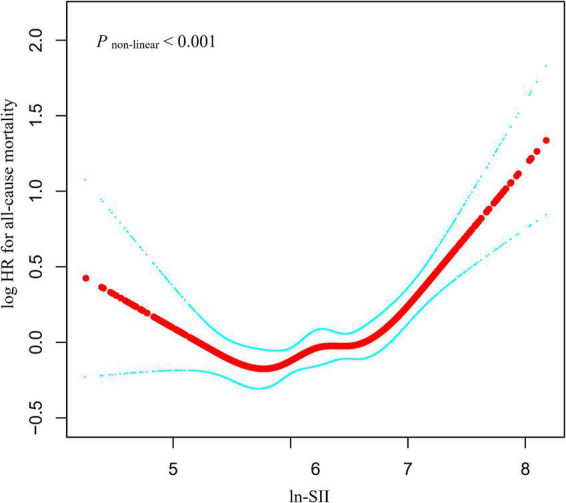
Relationship between ln-SII and all-cause mortality by smooth curve fitting. Adjustment for sex, age, body mass index (BMI), ethnicity, waist circumference, education level, marital status, family poverty income ratio, alcohol user, smoke, malignancy, stroke, asthma, diabetes, hypertension, albumin, estimated glomerular filtration rate (eGFR), alanine aminotransferase (ALT), aspartate aminotransferase (AST), total cholesterol, hemoglobin A1c (HbA1c), high-density lipoprotein (HDL) cholesterol, creatinine, and uric acid. The red line demonstrates the risk of mortality, and the blue dotted lines illustrate its 95% confidence interval (CI).