FIGURE 6.
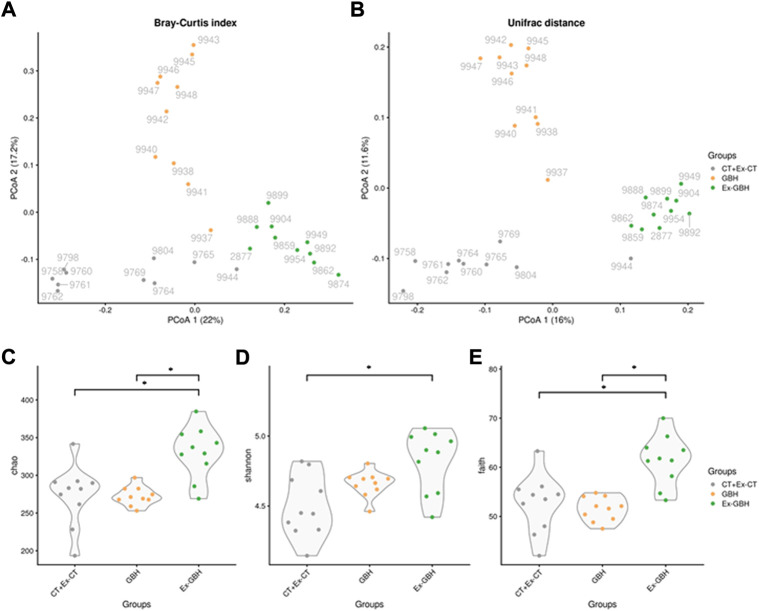
Microbiome β-diversity in cecal content of hens exposed to GBH for 42 days (GBH, n = 9), then non-exposed until D70 (Ex-GBH, n = 12) and controls at D42 and D70 taken together (CT + Ex-CT, n = 10), collected during (D42) and after GBH exposure (D70) measured by principal coordinates analysis (PCoA) on Bray–Curtis index (A) and Unifrac distance (B). Results are presented as individual values. Microbiome α-diversity in the very same groups measured by Chao (C), Shannon (D) and Faith indices (E). *p ≤ 0.05. CT + Ex-CT: Control and ex-Control taken together, GBH: Glyphosate-Based Herbicide, Ex-GBH.

