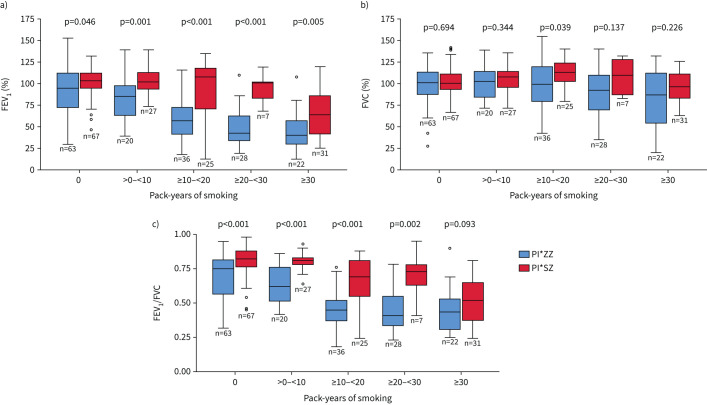
FIGURE 1.
Comparison of per cent predicted forced expiratory volume in 1 s (FEV1 % pred) (a), forced vital capacity (FVC) (b) and FEV1/FVC (c) between participants in the Spanish registry with the PI*ZZ and PI*SZ genotypes. In each box plot, the median value is indicated by the centre horizontal line, and the 25th and 75th percentiles are indicated by the lower and upper box horizontal lines. Circles indicate the outliers. p-values determined using a t-test. There was a statistically significant difference between pack-years of smoking groups for FEV1 % pred and FEV1/FVC for both the PI*ZZ genotype (p-value for trend <0.001) and PI*SZ genotype (p-value for trend <0.001). For FVC % pred, the p-value for trend was p=0.004 for PI*ZZ and p=0.29 for PI*SZ.

