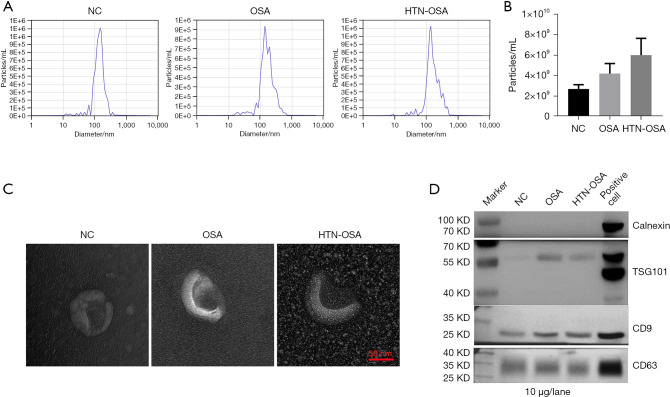
Figure 1.
Isolation and characterization of exosomes. (A) NTA of the exosome size and concentration. (B) Statistical analyses of the exosome concentrations. (C) TEM analysis of the exosome morphology and size. (D) Western blot analysis of the expression of exosome-specific proteins TSG101, CD9, and CD63 and of calnexin. NTA, nanoparticle tracking analysis; TEM, transmission electron microscope. NC, normal control; OSA, obstructive sleep apnea; HTN, hypertension.

