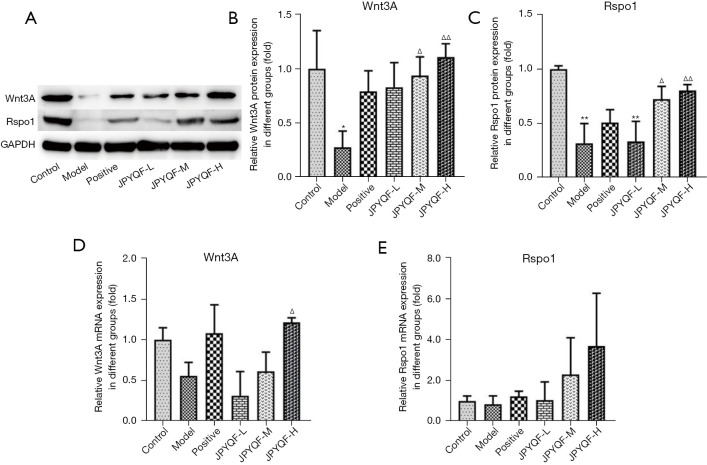
Figure 9.
Protein (A-C) and relative mRNA (D,E) expression levels of Wnt3A and Rspo1 in gastric tissue of rats in each group. Compared with the control group, *, P<0.05, **, P<0.01; compared with the model group, ∆, P<0.05, ∆∆, P<0.01. All experiments were repeated 3 times. JPYQF-L, Jian-Pi-Yi-Qi-Fang low-dose group; JPYQF-M, Jian-Pi-Yi-Qi-Fang middle-dose group; JPYQF-H, Jian-Pi-Yi-Qi-Fang high-dose group.

