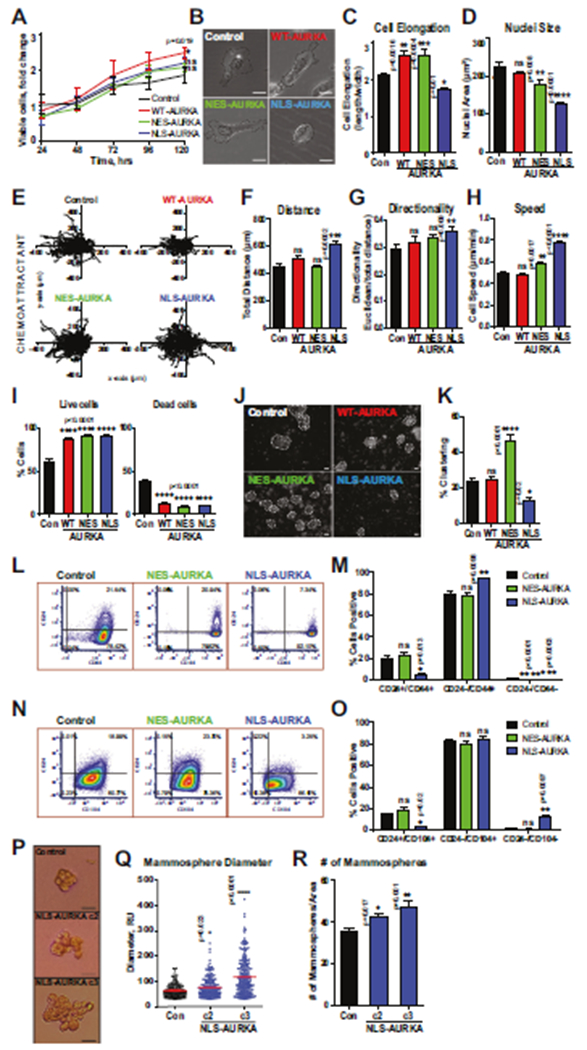
Fig. 2. N-AURKA drives cancer migration/invasion but does not affect proliferation.

A Cell proliferation/viability assay, mixed-effect model analysis on cell growth. B Representative bright-field images of cells, scale bar-10 μm. C Cell elongation index and D nuclei size. E Individual cell movement tracking-plots toward chemoattractant. Graphs of F total distance, G cell-body directionality, H cell speed. I Quantification of anoikis (live/dead cells). J Representative bright-field images of clusters, scale bar-50 μm, K Quantification of clusters as in J; 3–6 randomly-assigned fields/per clone normalized to area, ≥ 40cells/clone. L–O Representative flow cytometry dot-plots and quantification of CD24/CD44/CD104 positive cells. P Representative images of mammospheres. Scale bar-50 μm. Mammosphere quantification of Q diameter, R # mammospheres/area. One-way ANOVA, ±S.E.M, Dunnett’s test, ns non-significant.
