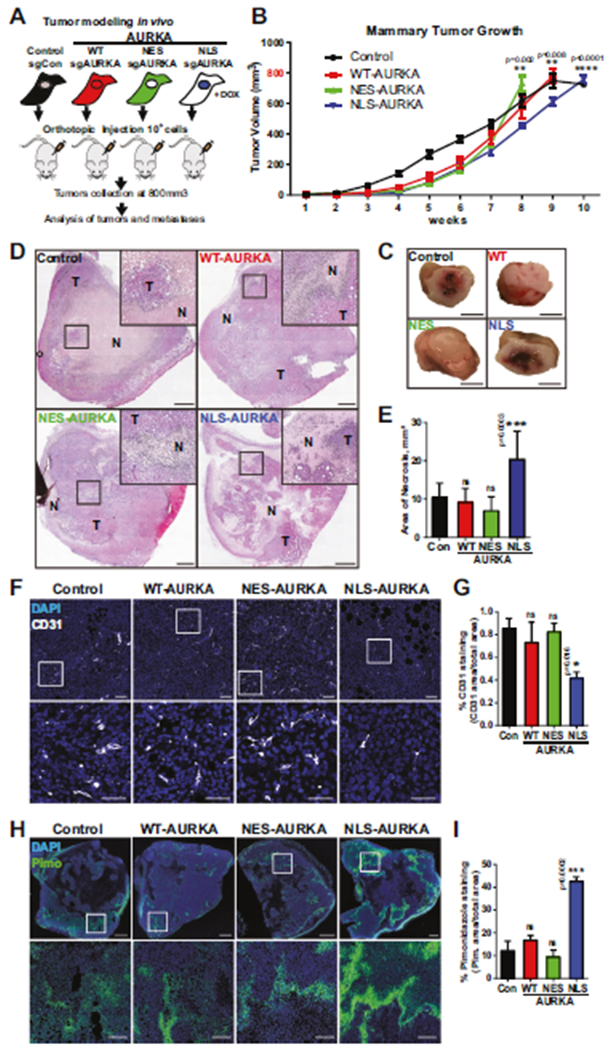
Fig. 3. N-AURKA induces hypoxia in xenograft models of breast cancer.

A Experimental design of xenograft study, n = 2 clones/subline, n ≥ 5 mice/group, n = 2 experiments. B Quantification of ultrasound-based tumor volume (mm3) plotted over time. Mixed-effect model analysis. C Representative images of gross tumor pathology, scale bar-5 mm. D Tumor H&E images, inset-necrotic area, scale bar-1 mm. E Quantification of necrosis/area in tumors. F Representative tumor images of F-IHC staining with CD31, scale bar-100 μm(top image), 50 μm(inset). G Quantification of CD31(+) staining area (%) as in F normalized to total area, DAPI/nuclei(blue), CD31(white). H Representative tumor images of F-IHC staining with anti-Pimonidazole (Hypoxyprobe-FITC/green), scale bar-1 mm(top image), 100 μm(inset). I Quantification of Pimonidazole (+) staining area (%) as in H normalized to total area, DAPI/nuclei(blue). One-way ANOVA, ±S.E.M, Dunnett’s test, ns non-significant.
