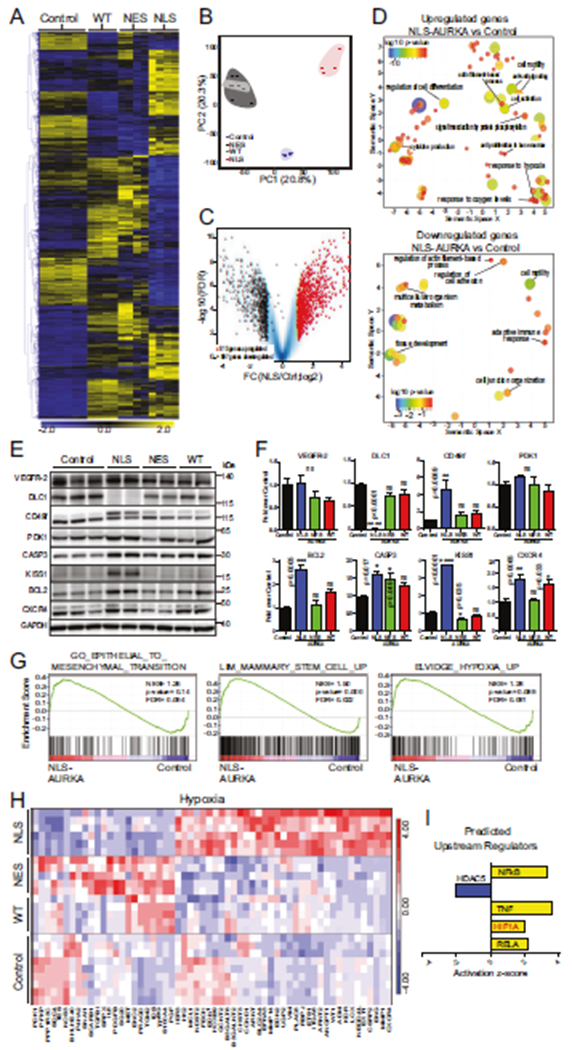
Fig. 5. RNA-seq profile of N-AURKA cells.

A Heat-map of differentially expressed genes (DEGs, mean values) in cells. Gene expression (n = 3167) is normalized log2 counts/million. B Principal Component Analysis of RNA-Seq libraries as in A. C Volcano-plot analysis of RNAseq data as in A NLS-AURKA vs. control, log2 fold changes of gene expression on the x-axis, FDR statistical significance (−log10 p value) on the y-axis; upregulated (red), downregulated (black) genes in NLS, all genes (blue). Genes with at least a >1.5 fold change and FDR < 0.01 are displayed. D Visualization of Gene Ontology terms for NLS-AURKA vs. control; up/downregulated GOterms (FDR < 0.1) are depicted as circles; the distance indicates the relationship between terms: closer distance means higher similarity. Color and size of circles indicate significance of differential expression of an individual GO term in log10 p value. E WB analysis of selected RNA-seq target proteins as in A. F Quantification of WB in E, fold change over control. G GSEA comparison NLS-AURKA vs. control for selected GOterm gene sets. H Heat-map of HIF-dependent DEGs. I Predicted upstream regulators: activated (yellow), inhibited (blue) using IPA activation z-score. One-way ANOVA, ±S.E.M, Dunnett’s test, ns non-significant.
