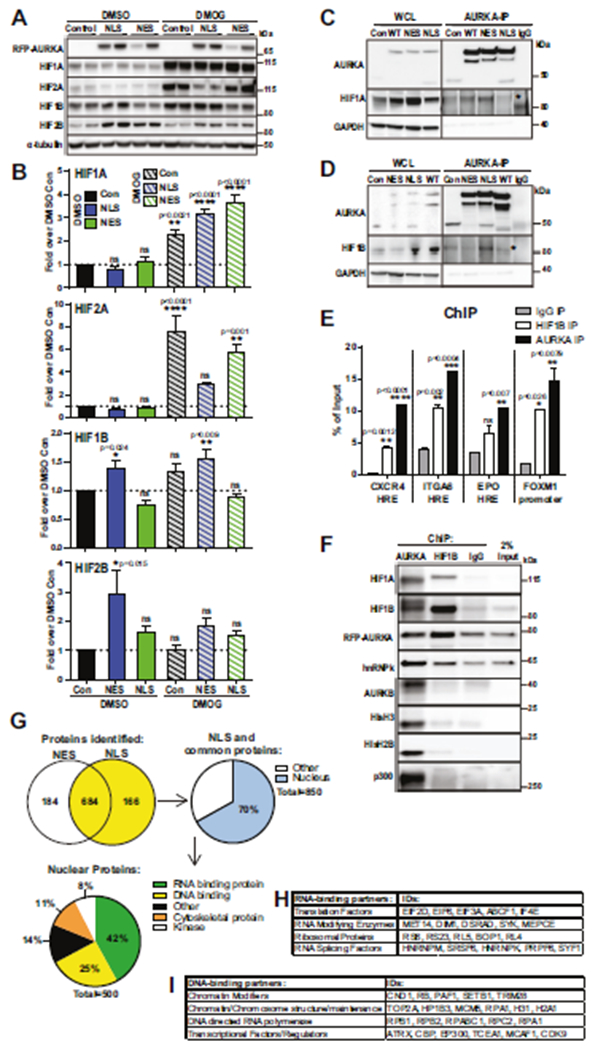
Fig. 6. N-AURKA binds to HIF1A/B and promotes transactivation of hypoxia-response genes.

A WB analysis of HIFs in cells with indicated antibodies, DMSO-vehicle or DMOG for 7 h. B Quantification of WB results as in A, fold of change over DMSO-control. C, D Representative images of Immunoprecipitation/WB analysis with indicated antibodies, WCL-whole cell lysate. E Quantification of ChIP qPCR against selected promoter region, normalized to total input. F WB analysis of ChIP (before de-crosslinking). G Mass-spectrometry analysis of AURKA-IP complexes: Venn diagram displaying the numbers of proteins found in the NLS- or NES-AURKA complexes. The 850 proteins/yellow were further filtered, nuclear/blue. Pie-chart showing distribution of N-AURKA binding partners based on functional Panther Gene Ontology terms. Tables showing selected nuclear protein classifications for H RNA-binding and I DNA-binding from PANTHER Gene Ontology. One-way ANOVA, ±S.E.M, Dunnett’s test, ns non-significant.
