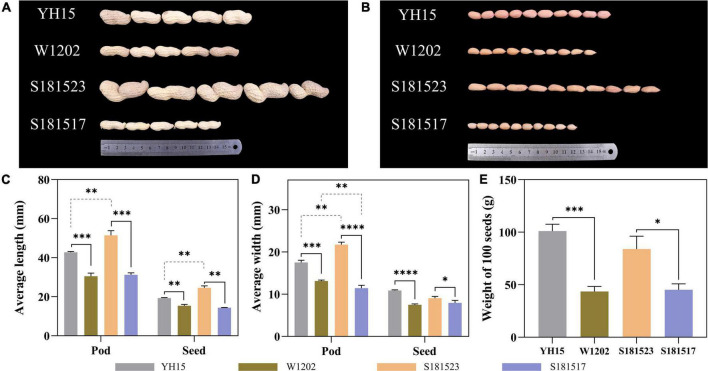
FIGURE 1.
Phenotypes and statistics of YH15, W1202, S181523, and S181527. (A) Pods of YH15, W1202, S181523, and S181527. (B) Seeds of YH15, W1202, S181523, and S181527. (C–E) Statistics of pod and seed length, width, and 100-seed weight. Error bars represent SD. *, **, ***, and **** represent p ≤ 0.05, **p ≤ 0.01, ***p ≤ 0.001, and ****p ≤ 0.0001, respectively.

