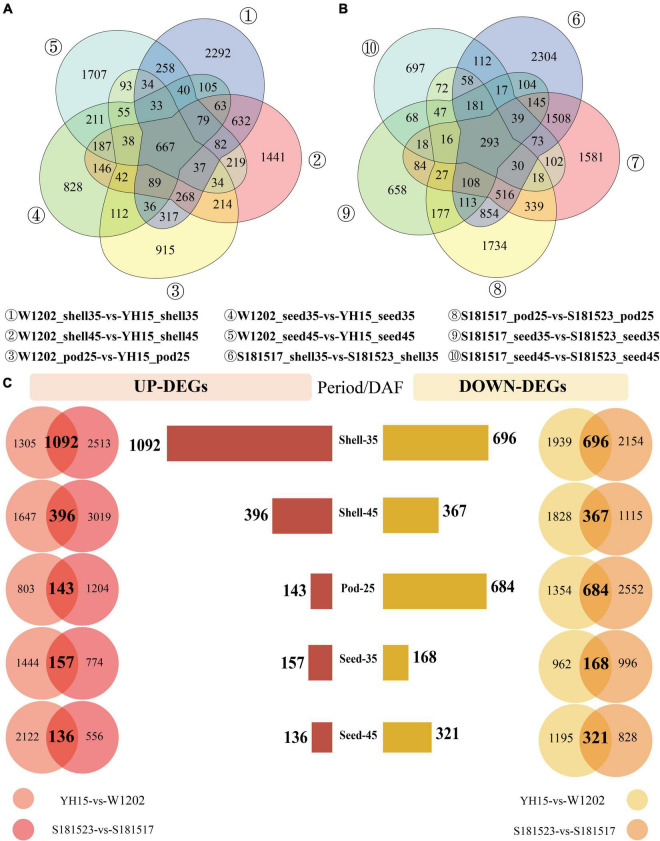
FIGURE 3.
Analysis of differentially expressed genes (DEGs) in the comparisons of YH15 vs. W1202 and S181523 vs. S181527. (| log2 fold-change| > 1, corrected p-value < 0.05). (A) The number of DEGs between YH15 and W1202 at each pod developmental stage. (B) The number of DEGs between S181523 and S181527 at each pod developmental stage. (C) The number of intersected DEG s in five phases: Shell-35, Shell-45, Pod-25, Seed-35, and Seed-45 DAF.

