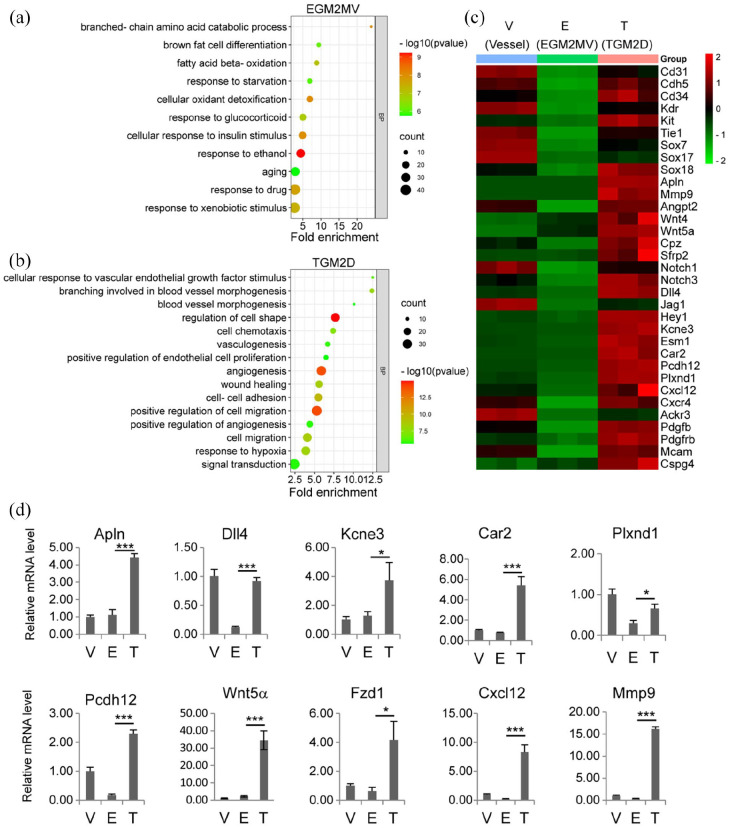
Figure 2.
Transcriptomic analysis of TGM2D: (a and b) GO analysis of the biological processes upregulated in EGM2MV (a) and TGM2D (b), (c) the heatmap of the genes that were downregulated in EGM2MV and upregulated in TGM2D and (d) quantitative RT-PCR verification of gene expression in different groups. Data were presented as mean ± SD. One-way ANOVA was performed on the data, followed by Bonferroni post hoc tests. *p < 0.05, ***p < 0.001.

