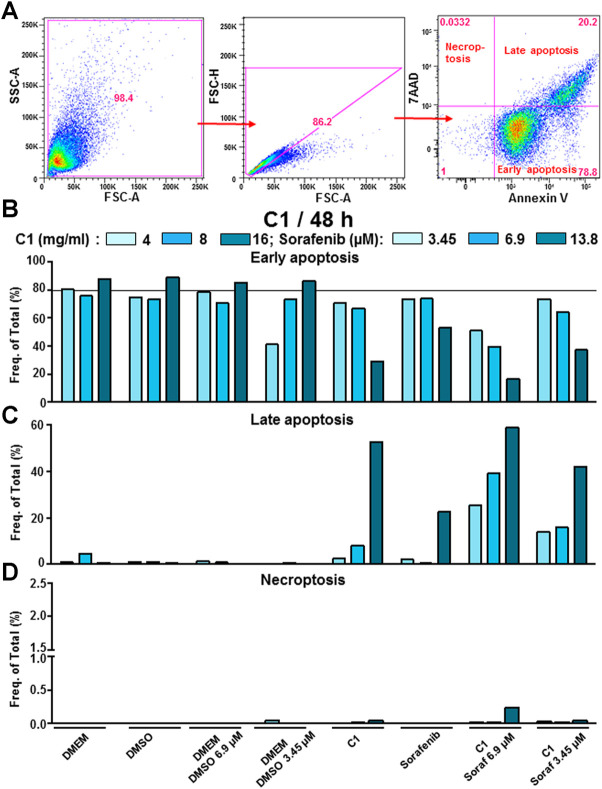
FIGURE 4.
C1 and its combination with sorafenib induced mostly late apoptosis in HCC cells. (A) Gating strategy to analyze early, late apoptosis, and necroptosis. Cells were gated using forward- and side scatter characteristics while avoiding duplicates. The analysis of three different populations based on 7-AAD and Annexin V-PE stainings was performed. The upper left quadrant indicate necroptotic, the lower right and upper right quadrants indicate early and late apoptotic cells, respectively. The results of FACS analysis showing frequencies in percent of (B) early, (C) late apoptotic and (D) necroptotic cells are presented. DMSO and DMEM were used as carrier (negative controls) for sorafenib and C1, respectively. The grey line represents the values for the control group (DMEM).

