Figure 1.
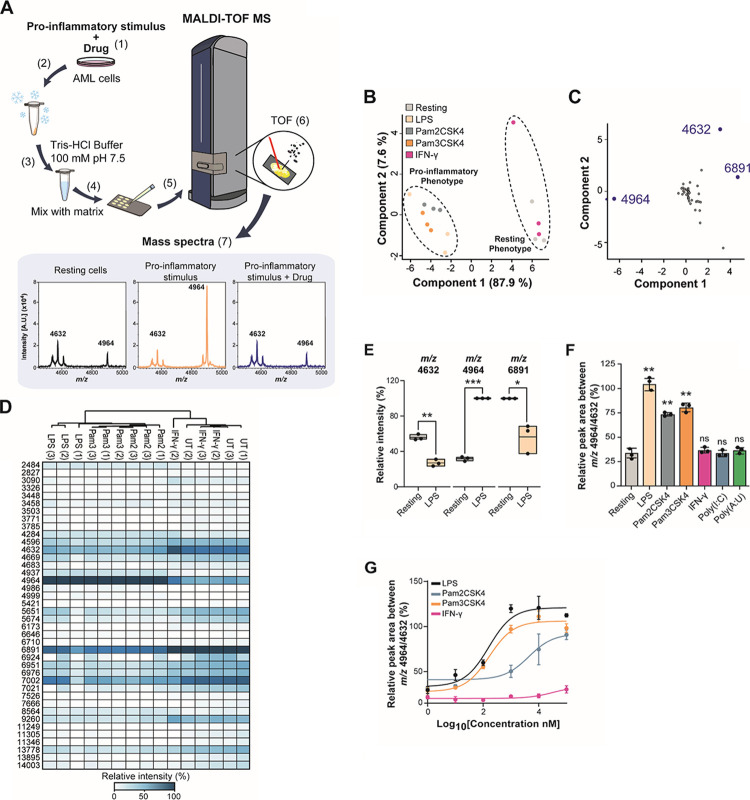
Identification of features associated with the monocyte inflammatory phenotype by MALDI-TOF MS. (A) Workflow of the MALDI-TOF MS assay: (1) AML cells were pre-treated with a drug for 1 h before adding a pro-inflammatory stimulus for 24 h. (2) Cells were frozen on dry ice, thawed, and (3) washed with 100 mM Tris–HCl buffer at 4 °C. (4) Cells were mixed with a matrix (10 mg/mL α-cyano-4-cinnamic acid in 50% acetonitrile, 0.1% trifluoroacetic acid). (5) Cells were analyzed in a rapifleX PharmaPulse MALDI TOF mass spectrometer. (6) In the ionization chamber, a laser is used to produce ions in the gas phase. These ions are separated according to their time-of-flight (TOF) in a field-free region. The smaller ions reach the detector first followed by the bigger ions, according to the m/z ratio. (7) The detector converts the received ions into electrical current which is amplified and digitized in m/z spectra. (B) Unsupervised PCA plot of LPS, Pam2CSK4, Pam3CSK4 and IFN-γ-treated cells showing separation of cells treated with bacterial ligands treated and resting monocytes. (C) Loading plot derived from PCA in panel (B) showing that m/z 4964 and 4632 contribute predominantly to the separation of the two clusters in component 1 and component 2. (D) Unsupervised heat map of the relative intensities of three biological replicates of THP-1 cells treated with 100 ng/mL LPS, Pam2CSK4, Pam3CSK4, 100 U/mL IFN-γ, 1 μg/mL poly(I:C), and poly(A:U) for 24 h compared to resting cells. (E) Box plots of significantly changing intensities between resting and LPS-treated monocytes identified at m/z 4632 and 4964. (F) Relative quantitation from three biological replicates of THP-1 cells treated with 100 ng/mL LPS, Pam2CSK4, Pam3CSK4, and 100 U/mL IFN-γ for 24 h compared to resting cells. (G) Titration of LPS, Pam2CSK4, and Pam3CSK4-treated cells from 10–100 ng/mL of stimulus. Significant differences between two groups were determined by the Mann–Whitney U-test. The statistical significance of the comparisons with resting is indicated as follows: ns, not significant; ***, P ≤ 0.001; **, P ≤ 0.01; *, P ≤ 0.05. Error bars represent the standard deviation of three biological replicates.

