Figure 5.
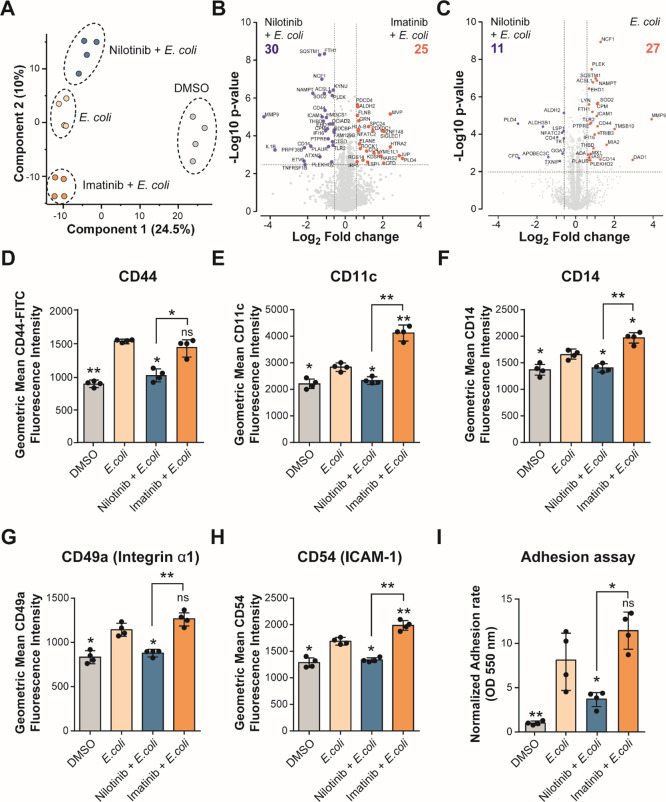
Nilotinib inhibits cell adhesion and monocyte activation. (A) PCA plot of log 2-transformed LFQ intensities from THP-1 cells pre-treated with DMSO, 5 μM nilotinib, or imatinib for 1 h before stimulation with live E. coli for up to 24 h, showing distinct grouping of treatments. (B,C) Volcano plot of THP-1 cells treated with (B) nilotinib vs imatinib and (C) nilotinib vsE. coli, a cutoff of FDR <0.05, and a 1.5-fold change between conditions. (D) Expression levels of CD44, (E) CD11c, (F) CD14, (G) CD49a, and (H) CD54 on the cell surface were measured by flow cytometry. (I) Optical density of dissolved crystal violet was used to evaluate the adhesion rate. Significant differences between two groups were determined by the Mann–Whitney U-test. The statistical significance of the comparisons with E. coli is indicated as follows: ns, not significant; *, P ≤ 0.05; **, P ≤ 0.01. Error bars represent the standard deviation of four biological replicates.

