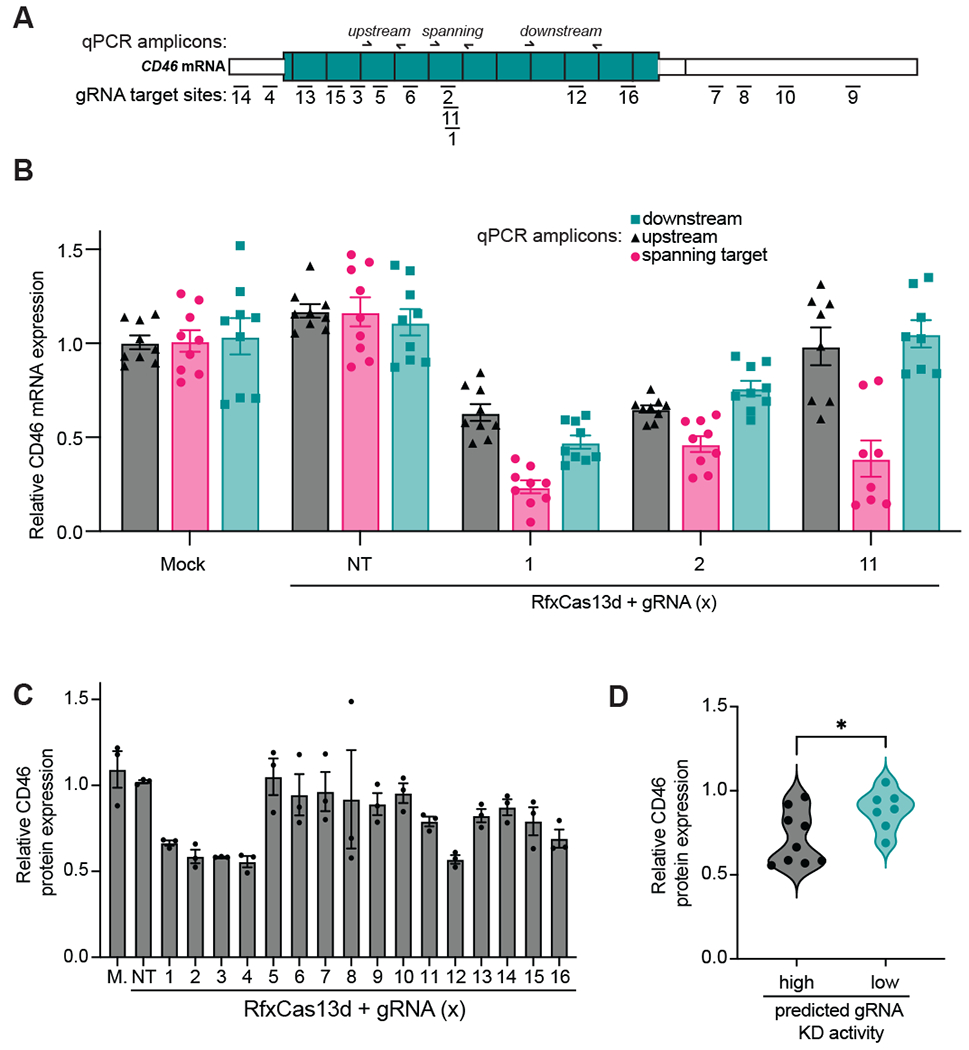
Figure 3. Considerations for measurement of Cas13 target RNA KD using RT-qPCR or flow-cytometry.

(A) A Schematic of CD46 mRNA and the positions targeted by each gRNA (used in panels B-D) and the positions of the RT-qPCR amplicons used in panel B. (B) The magnitude of target gene KD targeting CD46 mRNA and with the specified gRNAs and primer pairs as determined by RT-qPCR (n>3 replicates). GAPDH was used as a housekeeping control. Data were normalized to a mock transfection control. The error bars represent the mean ± SEM, respectively. (C) The magnitude of protein KD after targeting CD46 mRNA as determined by flow cytometry using a PE-labeled anti-CD46 antibody (n>3 replicates). Data were normalized to a mock (M.) transfection control. NT: non-targeting control gRNA. The error bars represent the mean ± SEM, respectively. (D) A correlation plot comparing a binned predicted gRNA score from Wessels et al. gRNA design algorithm (‘high’ and ‘low’ scoring gRNAs with corresponding scores above and below 0.5, respectively) with CD46 protein flow cytometry measurements obtained in panel C. * indicates statistical significance (p value: 0.0298 as determined by a two-tailed unpaired Welch’s t test).
