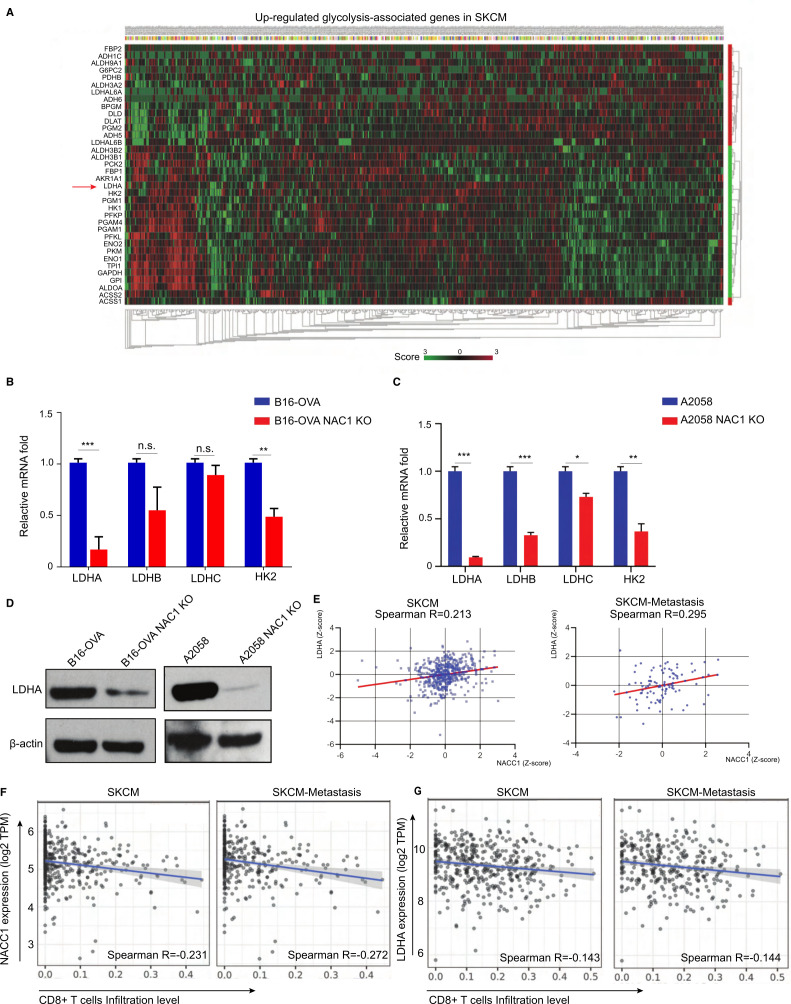
Figure 4.
NAC1 promotes the expression of LDHA in tumor cells. (A) Heatmap of normalized RNA-seq reads (Z score), top upregulated glycolysis-associated genes in the TCGA SKCM database. (B, C) qRT-PCR analysis of mRNA of LDHA, LDHB, LDHC, and HK2 in WT and NAC1 KO B16-OVA cells (B) or WT and NAC1 KO A2058 cells (C). The results are presented relative to the level of GAPDH. n=5 per condition from two independent experiments. *p≤0.05, **p≤0.01, ***p≤0.001. (D) LDHA expression in whole-cell extracts by Western blots. β-actin was used as a loading control. One representative experiment out of three is shown. (E) Correlations of NACC1 with LDHA gene expression (Z-score) were determined in a dataset including 470 melanoma tumors and 368 melanoma-metastatic tumors (‘R2: Tumor Skin Cutaneous Melanoma-TCGA-470-rsem-tcgars’). Pearson’s correlation was calculated. (F) Correlations of CD8+ T cell infiltration with NACC1 expression in melanoma (SKCM, n=470) and metastasis melanoma (SKCM-metastasis, n=368), (G) Correlations of CD8+ T cell infiltration level with LDHA expression in melanoma (SKCM, n=470) and metastasis melanoma (SKCM-metastasis, n=368), were estimated using TIMER algorithm. Pearson’s correlation was calculated. GAPDH, glyceraldehyde 3-phosphate dehydrogenase; LDHA, lactate dehydrogenase A; NAC1, nucleus accumbens-associated protein-1; SKCM, skin cutaneous melanoma; TCGA, The Cancer Genome Atlas; TIMER, Tumor Immune Estimation Resource.

