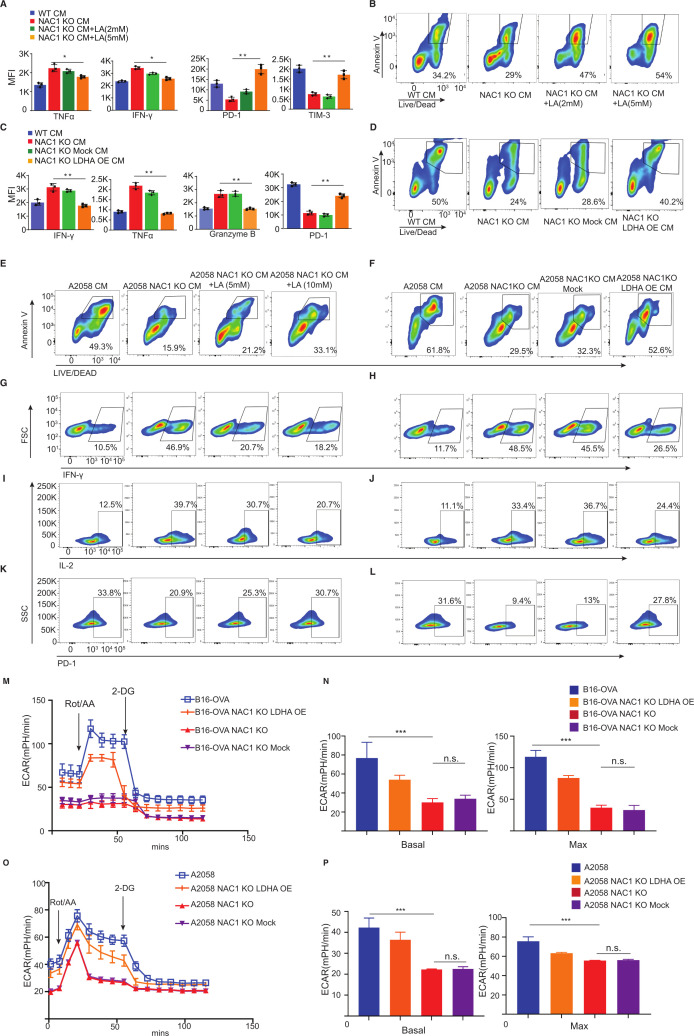
Figure 5.
Effects of LDHA expression and lactic acid level on cytokine production, apoptosis, and exhaustion of CD8+ T cells. Mouse or human CD8+ T cells were incubated with CM from mouse WT or NAC1 KO B16-OVA cells, or human WT or NAC1 KO A2058 tumor cells for 24 hours. In parallel, some T cells were incubated with CM from NAC1 KO tumor cells overexpressing LDHA (NAC1 KO LDHA OE) or an empty control (NAC1 KO Mock), or CM supplemented with LA (2–5 mM for mouse T cells; 5–10 mM for human T cells). (A) The production of cytokines TNF-α or IFN-γ and expression of PD-1 and TIM-3 of mouse CD8+ T cells with CM from mouse WT or NAC1 KO B16-OVA cells, or CM supplemented with LA by flow cytometry. One-way ANOVA with multiple comparisons correction. *p≤0.05, **p≤0.01. (B) Apoptosis of mouse CD8+ T cells with CM from mouse WT or NAC1 KO B16-OVA cells, or CM supplemented with LA. (C) The production of cytokines and expression of PD-1 of mouse CD8+ T cells with CM from mouse WT or NAC1 KO B16-OVA cells, or CM from NAC1 KO tumor cells overexpressing LDHA or an empty control by flow cytometry. One-way ANOVA with multiple comparisons correction. **p≤0.01. (D) Apoptosis of mouse CD8+ T cells with CM from mouse WT or NAC1 KO B16-OVA cells, or CM from NAC1 KO tumor cells overexpressing LDHA or an empty control by Annexin V staining. (E, F) Apoptosis of human CD8+ T cells with CM from human WT or NAC1 KO A2058 cells, or CM supplemented with LA or CM from human NAC1 KO tumor cells overexpressing LDHA or an empty control by Annexin V staining. (G, H) The production of IFN-γ of human CD8+ T cells with CM from human WT or NAC1 KO A2058 cells, CM supplemented with LA, or CM from human NAC1 KO tumor cells overexpressing LDHA or an empty control. (I, J) The production of IL-2 of human CD8+ T cells with CM from human WT or NAC1 KO A2058 cells, CM supplemented with LA, or CM from human NAC1 KO tumor cells overexpressing LDHA or an empty control. (K, L) Expression of PD-1 of human CD8+ T cells with CM supplemented with LA, or CM from human NAC1 KO tumor cells overexpressing LDHA or an empty control. (M) ECAR of mouse tumor cells measured by the Seahorse Metabolic Analyzer. Data are represented as mean±SEM; n=6 per condition from two independent experiments. (N) Basal glycolysis rates (left panel) and maximum glycolysis rate (right panel) of mouse tumor cells. One-way ANOVA with multiple comparisons correction. ***p≤0.001. (O) ECAR of human tumor cells measured by the Seahorse Metabolic Analyzer. Data are represented as mean±SEM; n=6 per condition from two independent experiments. (P) Basal glycolysis rates (left panel) and maximum glycolysis rate (right panel) of human tumor cells. One-way ANOVA with multiple comparisons correction. ***p≤0.001. ANOVA, analysis of variance; CM, conditional medium; ECAR, extracellular acidification rate; LDHA, lactate dehydrogenase A; NAC1, nucleus accumbens-associated protein-1; OVA, ovalbumin.

