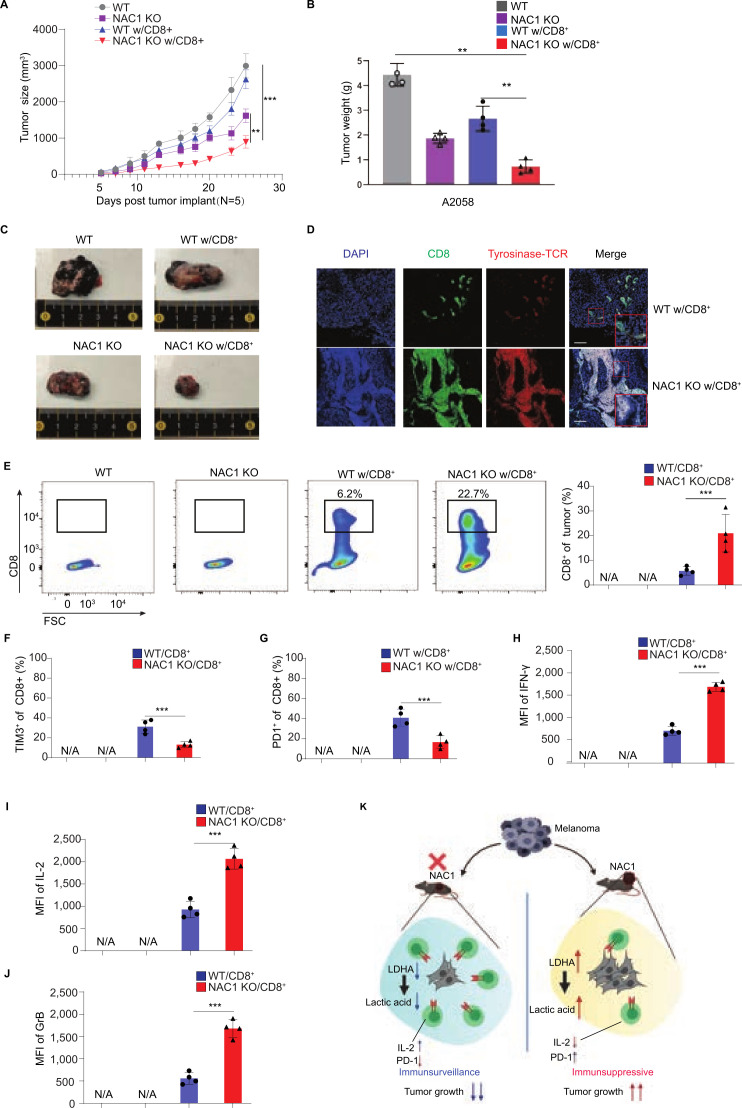
Figure 7.
NAC1 deficiency increases tumor CTL infiltration following an ACT in immune-deficient mice. Human WT A2058 or NAC1 KO A2058 tumor cells (1×10⁶) were s.c. injected into the flank of NSG mice, followed by treatment with or without the ACT of Tyrosinase-specific CD8+ T cells. (A) Graphical representation of the progression of tumor size. (B) The tumor weight was evaluated by scales and represented graphically. Values are mean±SEM of three independent experiments (n=5). (C) Indicated tumors were harvested and photographed at day 25. (D) CD8+ T cell infiltration (CD8+; green) in tumors (tyrosinase; red) was determined by immunofluorescence staining. Images are representative images taken from the tumors of three different mice. (E) Flow cytometric analysis of infiltrating CD8+ T cells (left panel) and quantitation of tumor infiltrating CD8+ T cells (right panel). Values are the mean±SEM of 3 independent experiments (n=5). (F) Flow cytometric analysis of infiltrating TIM-3+CD8+ T cells. (G) Flow cytometric analysis of infiltrating PD-1+CD8+ T cells. Values are the mean±SEM of 3 independent experiments (n=5). (H) Flow cytometric analysis of IFN-γ production of infiltrating CD8+ T cells. (I) Flow cytometric analysis of the IL-2 production of infiltrating CD8+ T cells. (J) Flow cytometric analysis of Granzyme B production of infiltrating CD8+ T cells. Values are the mean±SEM of four independent experiments (n=4). (K) Schematic representation of the hypothesis.**p≤0.01, ***p≤0.001. ACT, adoptive cell transfer; CTL, cytotoxic T lymphocytes; LDHA, lactate dehydrogenase A; MFI, mean fluorescence intensity; NAC1, nucleus accumbens-associated protein-1.

