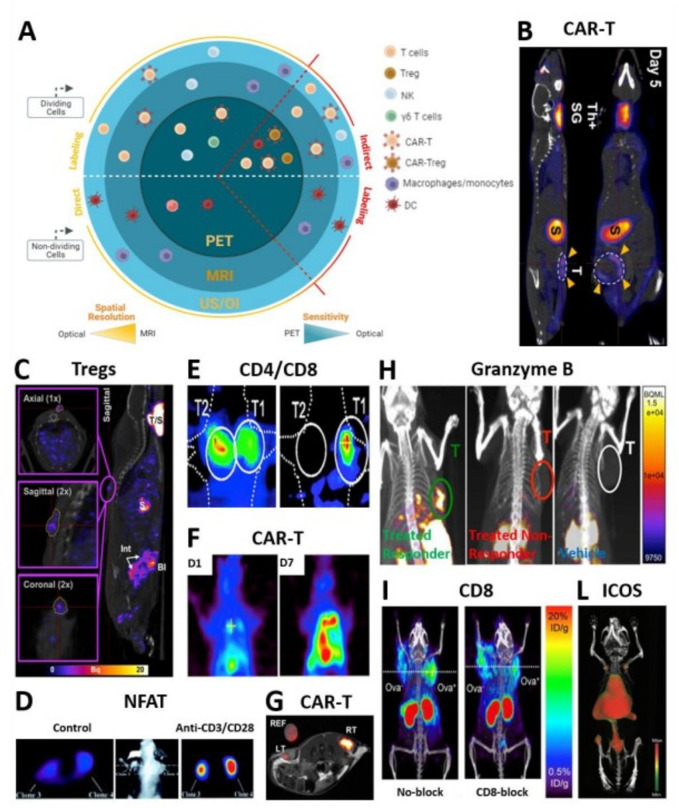
Figure 1.
Molecular imaging of cellular immunotherapies and immune-related biomarkers.| T cell trafficking and activation status and biomarkers visualized by different reporter-based and direct imaging modalities. (A) Sketch summarizing all immune cells amenable to molecular imaging through indirect and direct approaches. (B) Coronal and sagittal slices showing intra-tumorally injected panErbB-directed CAR-T cells tumor targeting and retention in a TNBC model by NIS/[18F]BF4- PET-CT 5 days post treatment.27 Indicated with yellow arrows are CAR-T cells residing at the tumor. Other signal is due to the endogenous NIS expression: ThSG is thyroid+salivary glands; S is stomach. (C) In vivo trafficking and persistence at the skin graft of intravenously administered polyclonal Tregs by NIS/99mTcO4- SPECT-CT.33 The sagittal image depicts a representative animal receiving 5×10⁶ hNIS-GFP+Tregs 30 days prior to imaging and residing at the skin graft. (D) Transaxial sections show a representative nude mouse bearing different subcutaneously injected Jurkat cells. The NFAT-mediated TKGFP+reporter responded to TCR activation by intravenous administration of anti-CD3/CD28 antibodies (right) as compared with anti-mouse control antibody (left).43 To allow for tracer clearance from the bloodstream and improve signal-to-noise ratio, HSV1-tk/ [124I]FIAU PET imaging was performed 24 hours post tracer administration. (E) Visualized is selective accumulation of systemically administered EBV-directed CD8+cells in HLA-A0201+EBV BLCL tumor (T1) by HSV1-tk/ [124I]FIAU PET (right). Although hNET/ [123I]MIBG SPECT images show a high accumulation of CD4+cells in corresponding HLA-DRB10701+EBV BLCL (T2) tumors (left), signal is detected also in T1 tumor (right), likely caused by the [124I]FIAU decay.22 Images were taken 4 hours post administration of a mixture of tracers. (F) [18F]-FEAU PET showing increased intrapleural accumulation of HSV-tk+mesothelin-targeted CAR-T cells by day seven post regional infusion in a orthotopic model of ffLuc+mesothelioma.74 The latter correlated to decreased tumor burden as depicted by tumor BLI (not shown). (G) TATP-F68-PFC labeled 1×10⁷ human CAR-T cells visualized by in vivo 19F MRI (RT: right tumor) as compared with F68-PFC control (LT: left tumor) in a mouse glioma model.75 19F image of injected cells is in pseudo-color; T2-weighted 1H image of tumors is in greyscale. (H) anti PD-1 and anti-CTLA-4 immunotherapy efficacy assessed 12 days post treatment by in vivo imaging of granzyme B as a marker of T cell activation using 68Ga-NOTA-GZP probe for PET-CT.41 Sagittal images showing differentiation between responders treated (green), non-responders treated (red) and vehicle treated (white) mice. (I) Representative PET-CT images acquired 22 hours post 89Zr-malDFO-169 cys-diabody injection and showing unblocked and CD8-blocked mice bearing EL4-Ova- (left) and EL4 Ova+ (right) tumors 5 days postadoptive OT-I T cell transfer.38 (L) Coronal-ventral view of CD-19-targeted CAR-T cell activation during anti-tumor response by 89Zr-DFO-ICOS mAb PET-CT. Signal due to successful targeting is detected in lumbar vertebrae, iliac bone, femur and tibia. Signal due to tracer clearance is in heart, spleen and liver. imaging performed 5 days post-CAR-T cell systemic delivery and 48 hours post-tracer administration.76 All figures adapted with permission from publishers. DC, dendritic cell; hNIS, human sodium iodide symporter; NFAT, nuclear factor of activated T cells; PET, positron emission tomography; SPECT, single photon emission computed tomography; TCR, T cell receptor; TNBC, triple-negative breast cancer.

