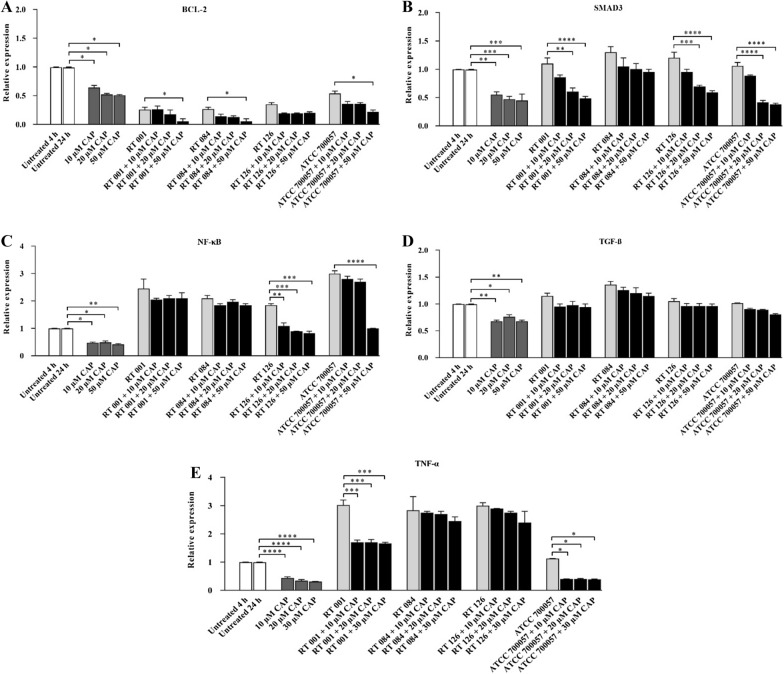
Fig. 6.
Relative expression of BCL-2 A, SMAD3 B, NF-κB C, TGF-β D and TNF-α E genes in HT-29 cells upon treatment with Tox-S (100 μg/ml) from C. difficile (RT 001, RT 126, RT 084), culture-filtrate (100 μg/ml) of C. difficile ATCC 700057, and different concentrations (10, 20, 50 µM) of capsaicin (CAP) measured by using quantitative real-time PCR assay. Gene expression data were normalized to β-actin as the reference gene. Data were presented as mean ± SD from three independent experiments. A P value of < 0.05 was considered as significant (*P < 0.05; **P < 0.01) by unpaired student’s t test and one-way ANOVA statistical analysis

