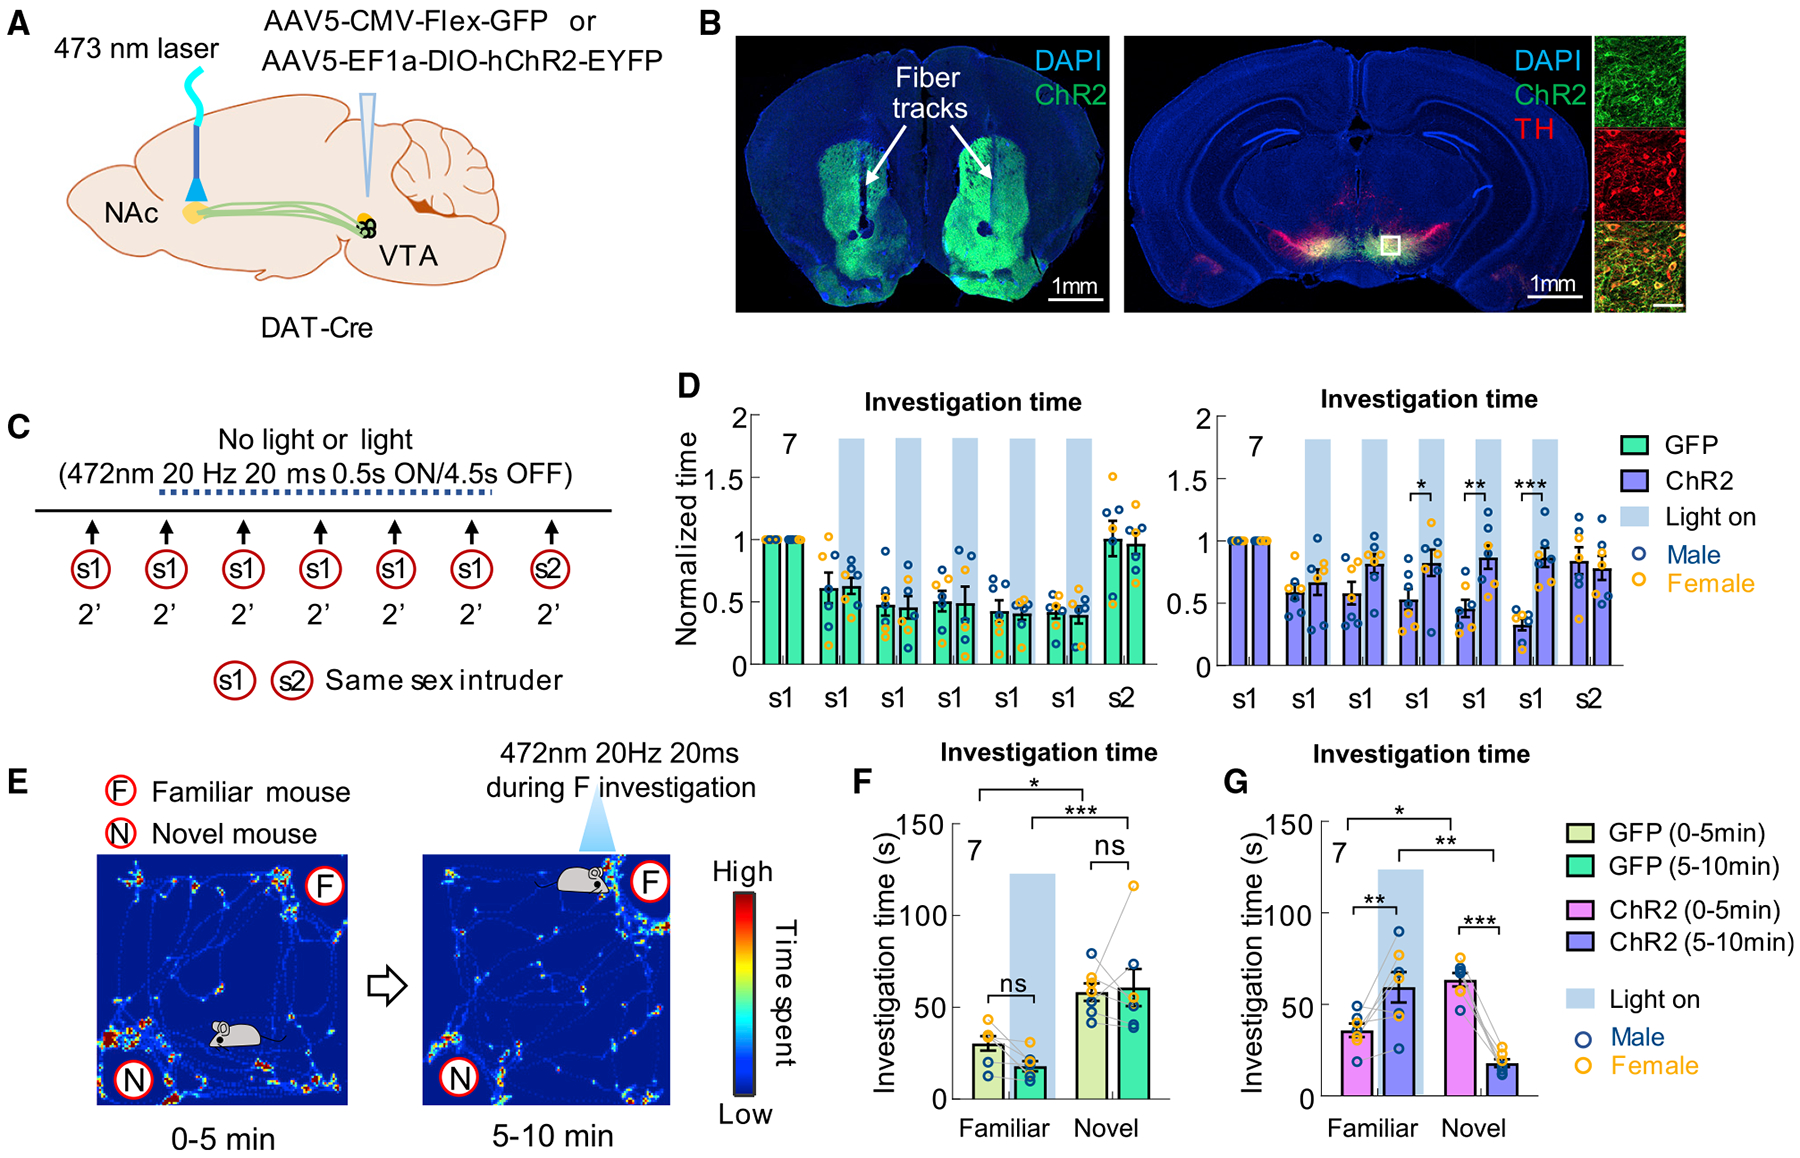
Figure 3. Increasing NAc DA promotes social investigation toward a familiar conspecific.

(A) Experimental strategy.
(B) Representative images showing ChR2-EYFP in the VTADA cells and NAc, amplified by immunostaining, and optic fiber tracks. Right shows the enlarged view of the boxed area. Scale bars, 1 mm (overview) and 100 μm (zoom-in view).
(C) The light stimulation protocol during habituation and dishabituation test.
(D) Normalized accumulated investigation duration in each 2-min session of the habituation and dishabituation test in GFP (left) and ChR2 animals (right).
(E) The light stimulation protocol during novel versus familiar preference test and heatmap showing the body center distribution of an example mouse during the test.
(F and G) Total investigation time of familiar and novel mice during different periods in GFP control animals (F) and ChR2 test animals (G).
Numbers in bar graphs represent number of test animals. Error bars in (D, F, and G) represent ±SEM. (D, F, G) Two-way ANOVA with Bonferroni’s multiple comparison test. *p < 0.05, **p < 0.01, and ***p < 0.001. See also Figure S2 and Table S1 for detailed statistics.
