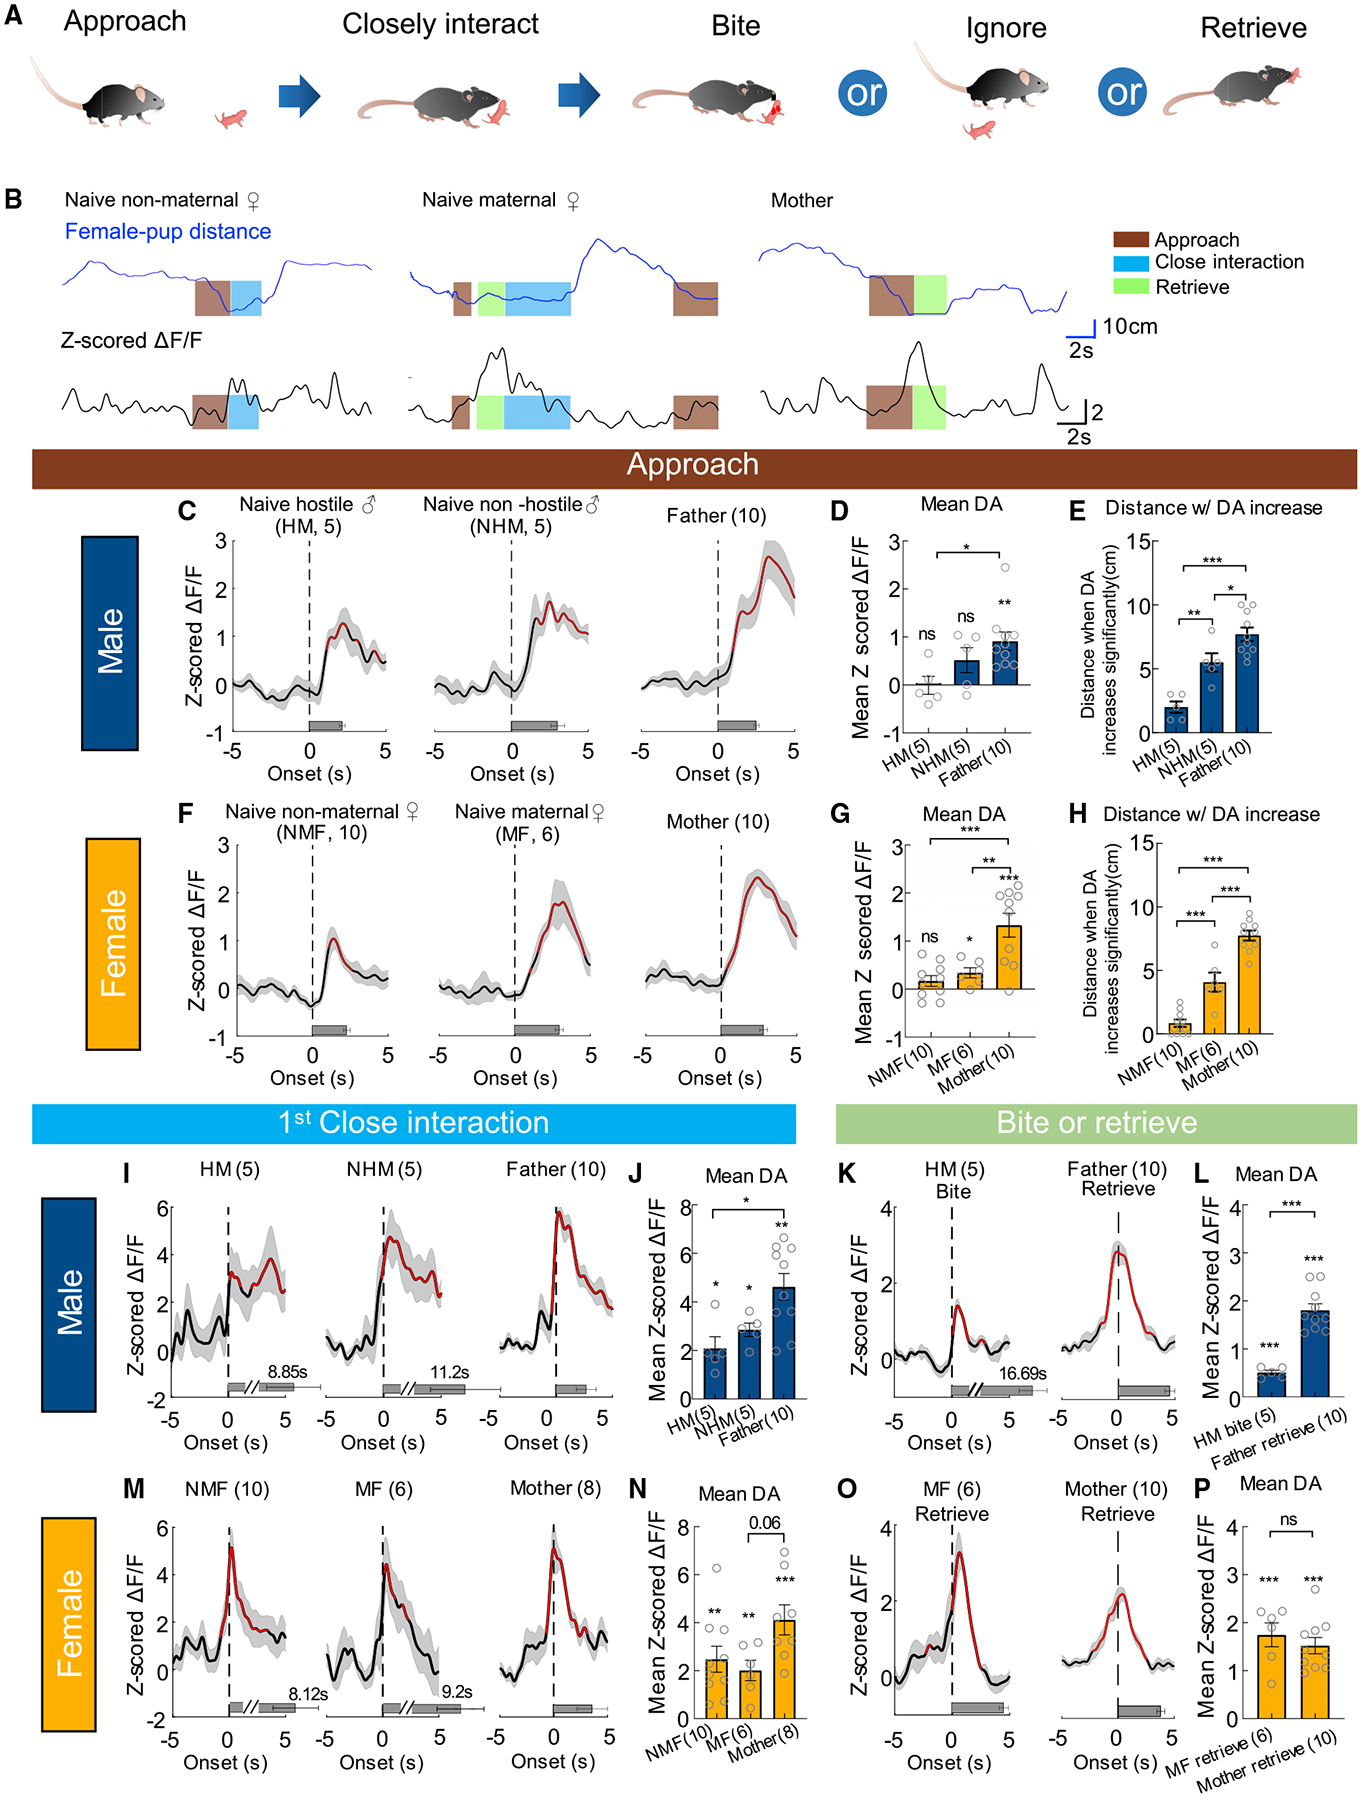
Figure 7. DA responses during pup-directed behaviors in naive and parental mice.

(A) A cartoon showing different stages of pup-directed behaviors.
(B) Representative traces showing distance from a pup (top) and Z scored ΔF/F of GRABDA2m (bottom) during pup interaction of an example naive non-maternal female mouse (NMF), a naive maternal female (MF), and a mother. Color shades indicate annotated behaviors.
(C) Average PETHs aligned to the onset of pup approach for male mice.
(D) Mean Z scored GRABDA2m responses during approaching pups for male mice.
(E) Distance from pups when the GRABDA2m responses become significantly increased during pup approach in male mice.
(F–H) The responses during pup approach in females, following the conventions as in (C–E).
(I) Average PETHs aligned to the onset of the first close interaction toward pups for male mice.
(J) Mean Z scored GRABDA2m responses during the first close interaction with a pup for male mice.
(K) Average PETHs aligned to the onset of biting pups in HMs and retrieving pups in fathers.
(L) Averaged Z scored GRABDA2m responses during biting pups and retrieving pups.
(M and N) The responses during the first close interaction with a pup in NMFs, MFs, and mothers, following the conventions as in (I and J). Two mothers were excluded as they retrieved pup without investigation.
(O and P) The responses during retrieving pups in MFs and mothers, following the conventions as in (K and L).
Numbers in bar graphs represent number of test animals. Error bars and shaded areas in (C–P) represent ±SEM. In (C, F, I, K, M, and O), red indicates periods with significantly increased DA level; horizontal bars indicate average durations of the behaviors. (D, E, G, H, N) One-way ANOVA with Tukey’s multiple comparisons test; (J) Kruskal-Wallis test with Dunn’s multiple comparisons test; one-sample t test (in D, G, and N) and one-sample Wilcoxon test (in J) followed by false discovery rate correction; (L, P) unpaired t test and one-sample t test. *p < 0.05, **p < 0.01, and ***p < 0.001. See also Figures S5, S6 and S9, and Table S1 for detailed statistics.
